Boxplot
What is a Boxplot?
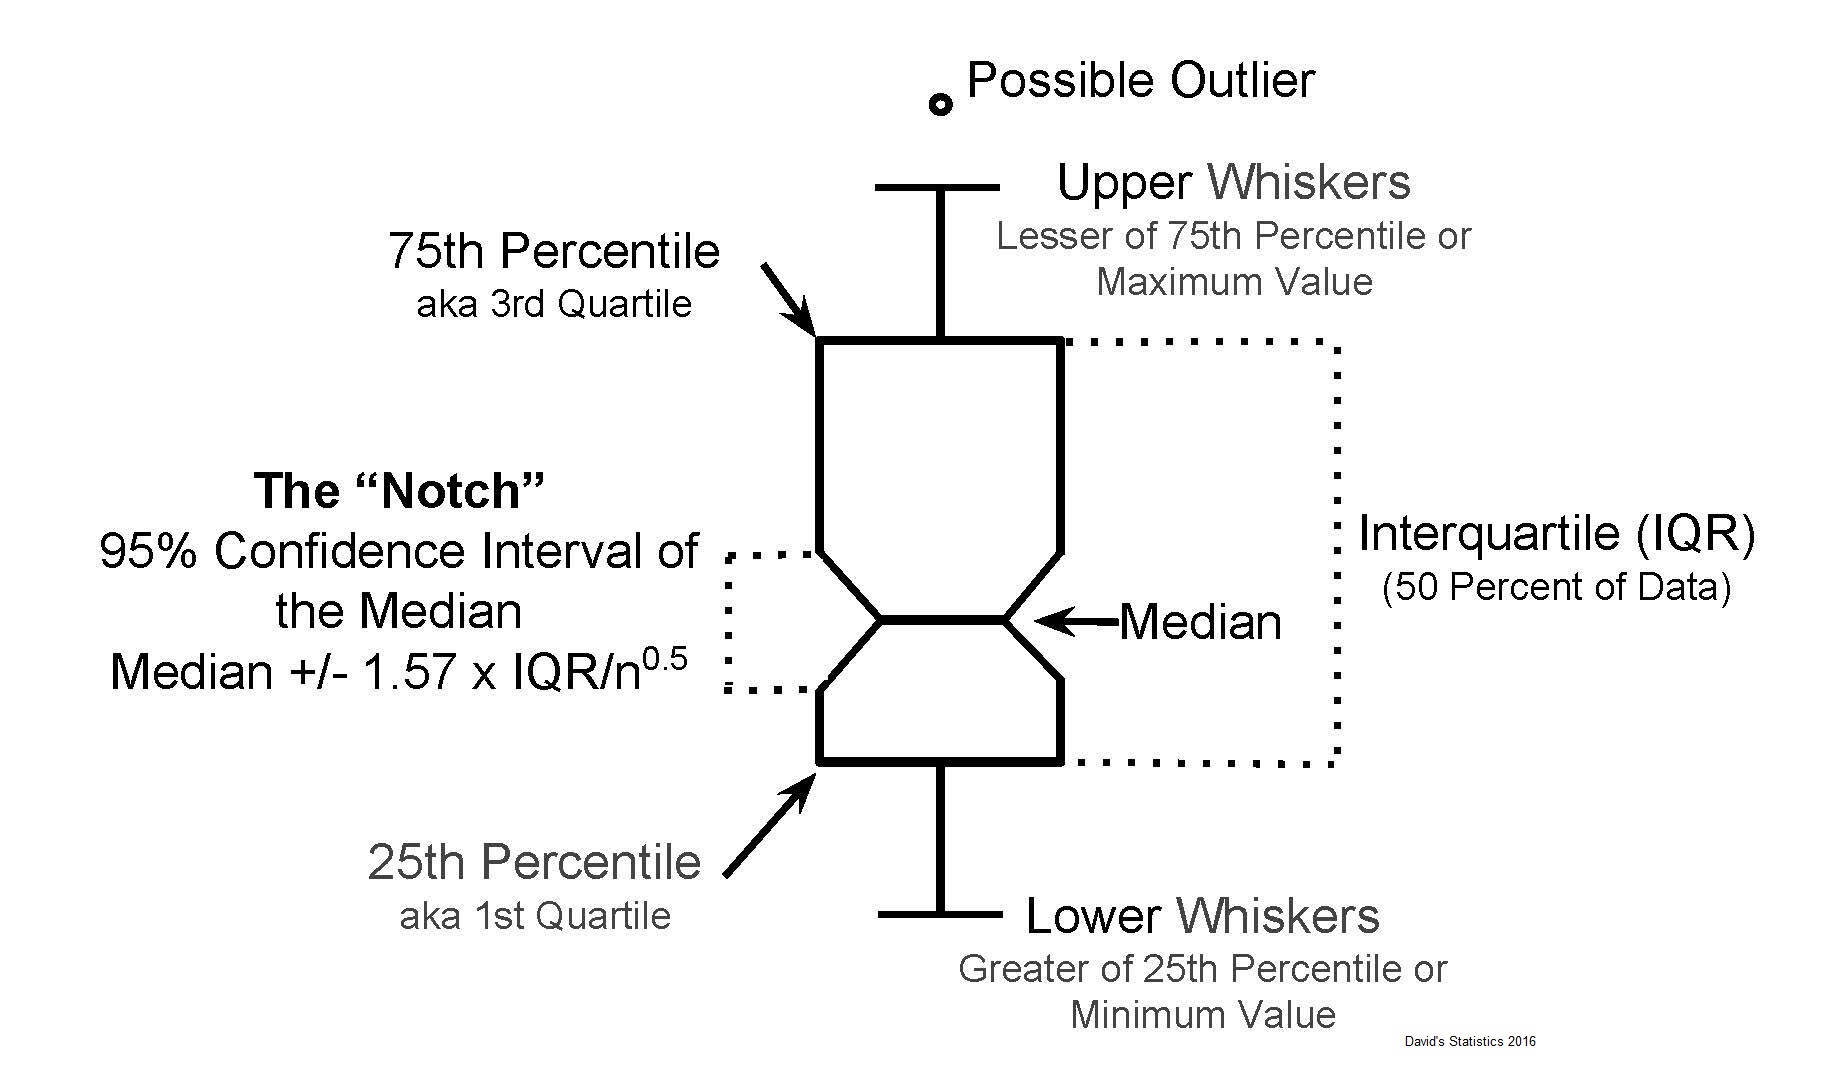
The box plot (also box-whisker plot) is a diagram used to graphically represent the distribution of a characteristic that is at least ordinally scaled. It thereby combines various robust measures of dispersion and location in one representation. A box plot is intended to give a quick impression of the range in which the data lie and how they are distributed over this range. Therefore, all values of the so-called five-point summary, i.e. the median, the two quartiles and the two extreme values, are shown.
Examine the following items to learn more about the location and spread of the sample data:
The Median is represented by the line in the box. The median is a common measure of the location of the data. Half of the observations are less than or equal to the value, the other half of the observations are greater than or equal to the value.
The interquartile range box interquartile range box represents the middle 50% of the data. It indicates the distance between the first and the third quartile (Q3-Q1).
The Whiskers start from both sides of the box. They represent the ranges for the bottom 25 % and the top 25 % of the data values excluding the outliers.
Outliers, i.e. data values that are far away from the other data values, can have a strong impact on your results. Often, the easiest way to identify outliers is in a boxplot, where they are marked with dots or circles under and over the whiskers.
The Notch displays the 95% confidence interval around the median.
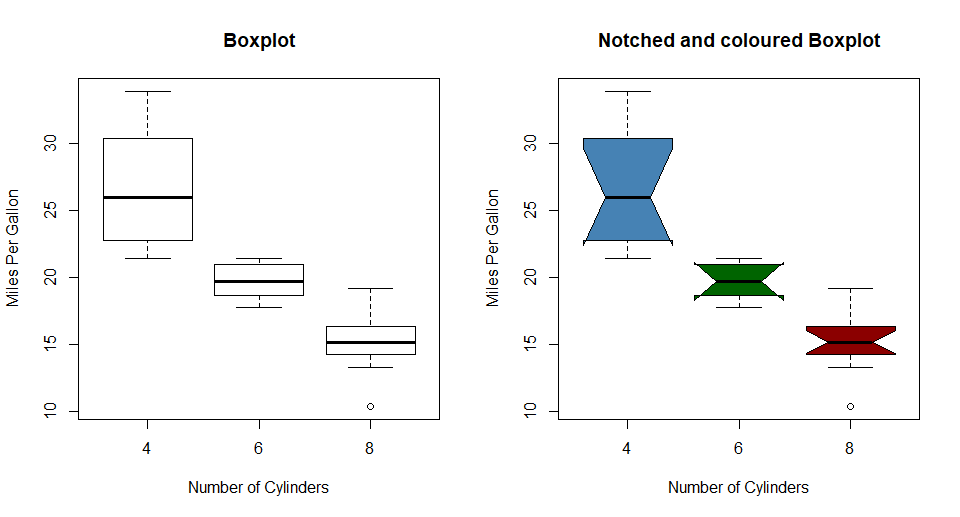
Example with mtcars:
Boxplot of MPG by Car Cylinders
boxplot(mpg~cyl,data=mtcars, main="Car Milage Data",
        xlab="Number of Cylinders", ylab="Miles Per Gallon")
Notched and coloured Boxplot of MPG by Car Cylinders
boxplot(mpg~cyl,data=mtcars, main="Car Milage Data", notch=TRUE,
        col=(c("steelblue","darkgreen", "darkred")),
        xlab="Number of Cylinders", ylab="Miles Per Gallon")