
Introduction
Setting up R and auxiliary programs for operating R and introducing a few tools if you get stuck.
R is a programming language designed created by Ross Ihaka and Robert Gentleman in 1992. As a an open-source language, which means that it is freely available for anyone to use, modify, and distribute, it became a popular tool for statistical analysis and data visualization with an active user community. It includes a wide range of statistical and graphical techniques, provides extensive tools for data manipulation, transformation, and cleaning and is highly extensible, allowing users to write their own functions and packages. This extensibility has led to a vast ecosystem of contributed packages for a wide range of specialized tasks and domains, including geography. Base R hat no graphical user interface for data preparation or analysis. These tasks are only performed by entering code into the script. Although this approach may seem intimidating to first-time users, it has the advantage of requiring thoughtful consideration of the analysis while simultaneously documenting all steps. Another advantage is that, in R, many analysis steps can be automated once they are defined.
“Since then, the popularity of R has grown in leaps and bounds because of its unrivaled flexibility for data analysis and powerful graphical tools, all for the princely sum of nothing.” – Tilman M. Davies, The book of R
Getting to know R
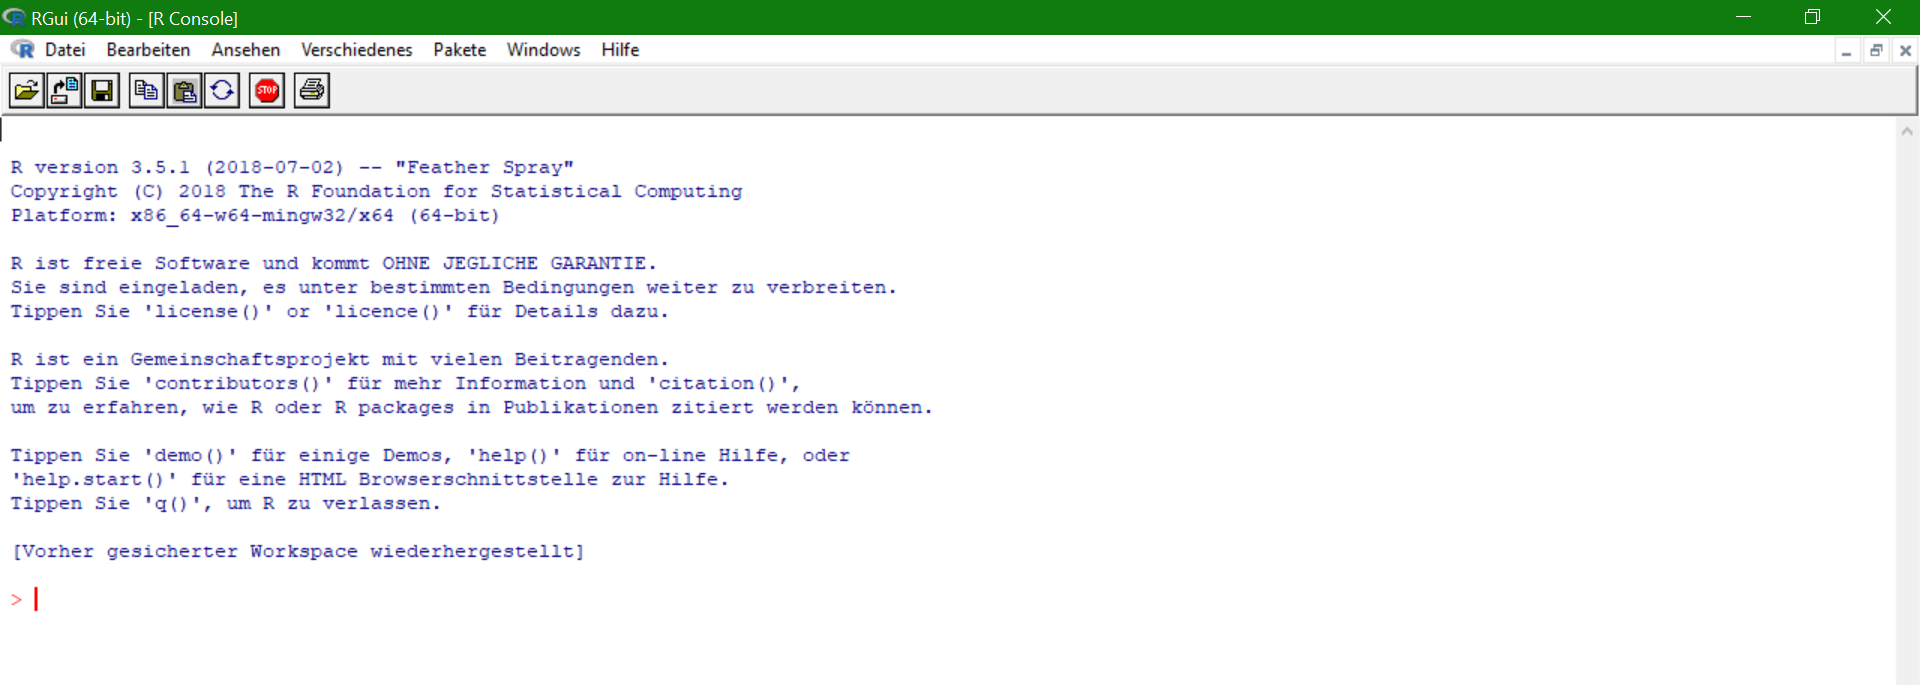
The r-project describe their work as such:
One of R’s strengths is the ease with which well-designed publication-quality plots can be produced, including mathematical symbols and formulae where needed. Great care has been taken over the defaults for the minor design choices in graphics, but the user retains full control.
Many users think of R as a statistics system. We prefer to think of it as an environment within which statistical techniques are implemented. R can be extended (easily) via packages. There are about eight packages supplied with the R distribution and many more are available through the CRAN family of Internet sites covering a very wide range of modern statistics.
R is available as Free Software under the terms of the Free Software Foundation’s GNU General Public License in source code form. It compiles and runs on a wide variety of UNIX platforms and similar systems (including FreeBSD and Linux), Windows and MacOS.
Getting to know RStudio
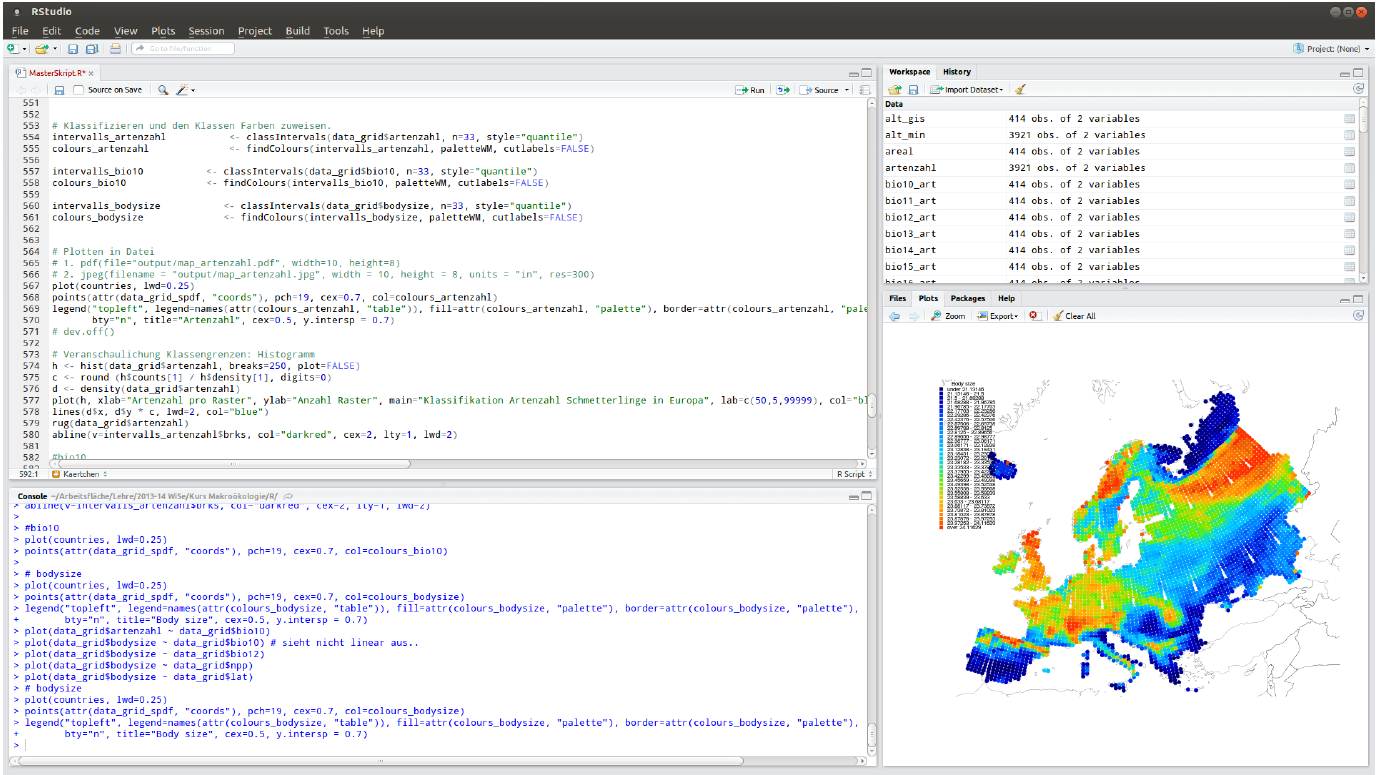
RStudio is an integrated development environment (IDE) for R. It includes a console, syntax-highlighting editor that supports direct code execution, as well as tools for plotting, history, debugging and workspace management.
What is the difference between R and RStudio?
Cran R (or simply R) is a programming language or a software environment as they call it for scientific computing and graphics and RStudio is an IDE for using R.
R and RStudio are not two different versions of the same thing. One can’t be substituted for the other. In fact, they work together. R is a programming language for statistical calculation. And RStudio is an Integrated Development Environment (IDE) that helps you develop programs in R. So if you want to learn more about them, you should start by learning R programming.
You can use R without using RStudio, but you can’t use RStudio without using R, so R comes first.
Now that this is clear, we continue with the installation:
Comments?
You can leave comments below if you have questions or remarks about any of the text or code in this unit. Please copy the corresponding line into your comment to make it easier to answer your question.