
| LM | Plotting Multiple Data |
📊 Plotting Multiple Data Series on One Graph
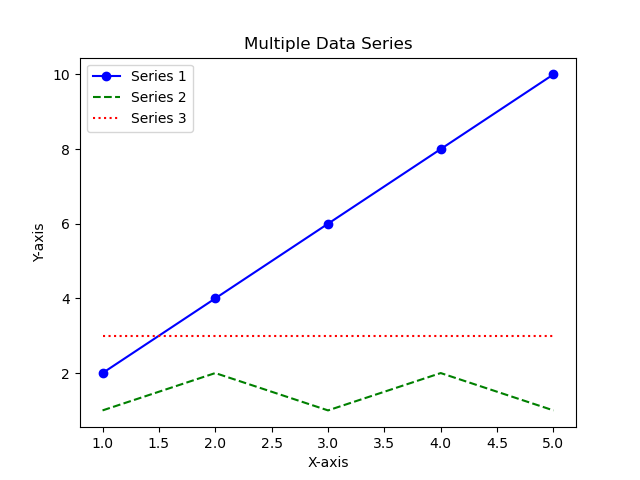
Sometimes you want to display several data series on the same plot to compare them easily.
🟢 Example
import matplotlib.pyplot as plt

# First data series
x = [1, 2, 3, 4, 5]
y1 = [2, 4, 6, 8, 10]

# Second data series
y2 = [1, 2, 1, 2, 1]

# Third data series
y3 = [3, 3, 3, 3, 3]

# Create the plot
plt.plot(x, y1, label='Series 1', color='blue', marker='o')
plt.plot(x, y2, label='Series 2', color='green', linestyle='--')
plt.plot(x, y3, label='Series 3', color='red', linestyle=':')

# Add title and labels
plt.title("Multiple Data Series")
plt.xlabel("X-axis")
plt.ylabel("Y-axis")

# Add legend
plt.legend()

# Show plot
plt.show()
✅ Save the Plot
You can save your plot to a file instead of (or in addition to) showing it on screen:
plt.savefig("multiple_series_plot.png")
Call plt.savefig() before plt.show() to ensure the file is saved correctly.
💡 Tips
- Use different colors and line styles to clearly distinguish the data series.
- Make sure to include a legend so your plot is easy to understand.
- You can save plots in different formats (e.g.,
.png,.pdf,.svg) by changing the file extension insavefig().