Overview
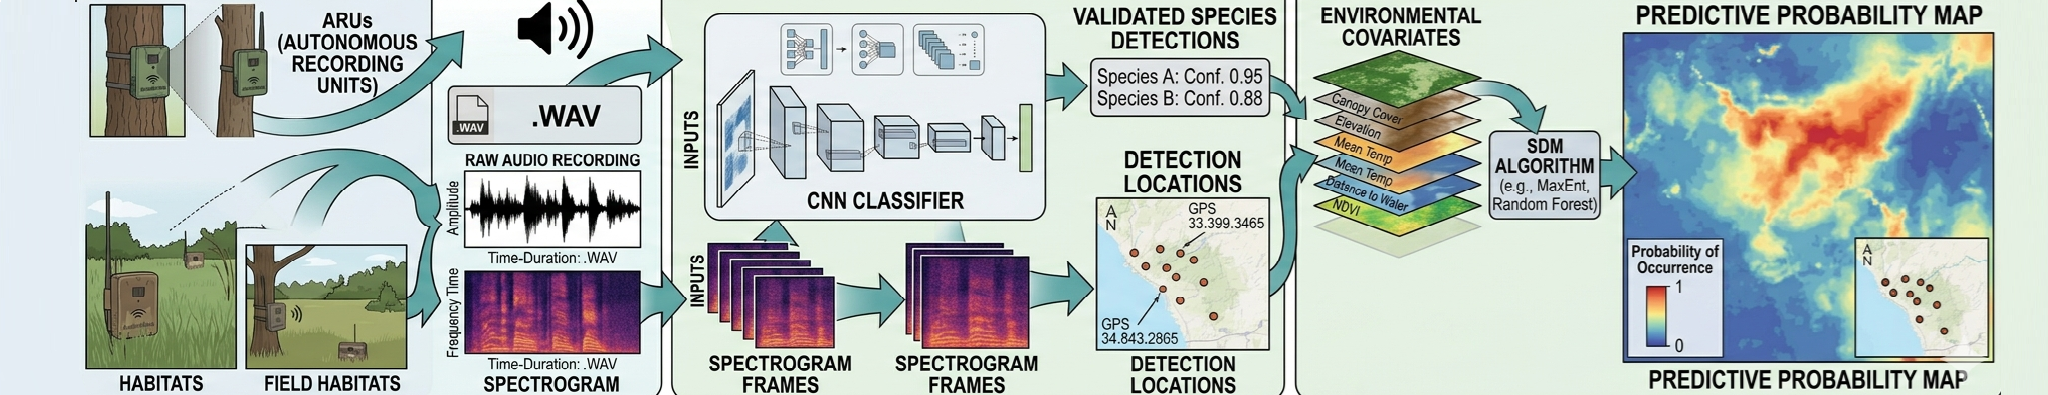
This unit focuses on modeling acoustic detection probability to understand the dynamic “acoustic phenology” of a species. You will learn to integrate bioacoustic recordings with time-series environmental data to predict when and where a species is likely to be heard. By implementing spatial cross-validation and Random Forest classifiers, you will build a robust pipeline to visualize a species’ acoustic footprint across the landscape.
Learning Objectives
At the end of this unit, you should be able to:
- Distinguish Presence from Detectability: Understand the conceptual difference between a species’ occupancy and its seasonal or daily acoustic activity.
- Synchronize High-Resolution Predictors: Align acoustic detection timestamps with dynamic environmental data like temperature.
- Implement Spatial Cross-Validation: Apply k-fold Nearest Neighbor Distance Matching (kNNDM) to prevent model over-fitting caused by clustered recorder locations.
- Map Spatio-Temporal Acoustic Activity: Generate and interpret daily probability maps to visualize how the acoustic activity of a species shifts across the study area over time.