
Summary
Summary
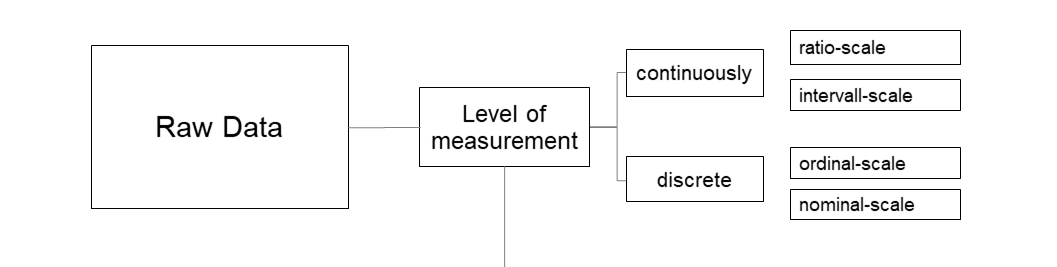
Remember that the top-level category is either quantitative or qualitative (numerical or not). From there, quantitative data can be grouped into “discrete” or “continuous” data. That covers most of it.
In summary, nominal variables are used to “name,” or label a series of values. Ordinal scales provide good information about the order of choices, such as in a customer satisfaction survey. Interval scales give us the order of values AND the ability to quantify the difference between each one. Finally, Ratio scales give us the ultimate–order, interval values, plus the ability to calculate ratios since a “true zero” can be defined.
The data will be also assigned to a certain data type in R: integer (whole numbers, no decimal), double (fractional number), character-strings (letters, symbols and text) and Boolean (true/false). Make sure that your data has the right datatype, which can be assessed by a proceeding “is.”, and, if necessary, transformed by a proceeding “as.”
| Provides | Nominal | Ordinal | Interval | Ratio |
|---|---|---|---|---|
| Counts, Frequency of Distribution | X | X | X | X |
| Mode | X | X | X | X |
| The order of values is known | X | X | X | |
| Median | X | X | X | |
| Mean | X | X | ||
| Can quantify the difference between each value | X | X | ||
| Can add or substract values | X | X | ||
| Can multiply and divide values | X | |||
| has a true zero | X |