| LM | Google Earth Engine basics |
Learn the essentials of Google Earth Engine, Earth Engine Data Catalog and java scripting
What is Google Earth Engine?
Google Earth Engine is a powerful platform designed for analyzing and visualizing environmental data. Imagine you have a supercomputer that can access a huge library of satellite images of Earth taken over the last few decades. This is what Google Earth Engine provides.
Why GEE is relevant to us?
Massive Satellite Imagery Database: Google Earth Engine has a vast collection of satellite images. This database is constantly updated and includes historical data, which is great for observing changes over time.
Powerful Computing Resources: You don’t need a high-end computer to use it. Google Earth Engine does the heavy lifting on its servers, so you can run complex analyses and algorithms through a web interface without needing powerful hardware.
Environmental Monitoring and Analysis: It’s widely used for environmental research like tracking deforestation, monitoring water levels in lakes and rivers, observing the melting of glaciers, and analyzing urban development.
Accessible to Non-Experts: The platform is designed to be user-friendly, so even if you’re not an expert in remote sensing or geographical information systems (GIS), you can still use it. There’s a bit of a learning curve, but there are plenty of tutorials to help you get started.
Collaboration and Sharing: You can collaborate with others and share your findings. It’s a great tool for group projects or research work.
Real-World Applications: The data and insights gained from Google Earth Engine can have real-world implications, such as helping to inform policy decisions on climate change or natural resource management.
Introduction to the GEE code editor
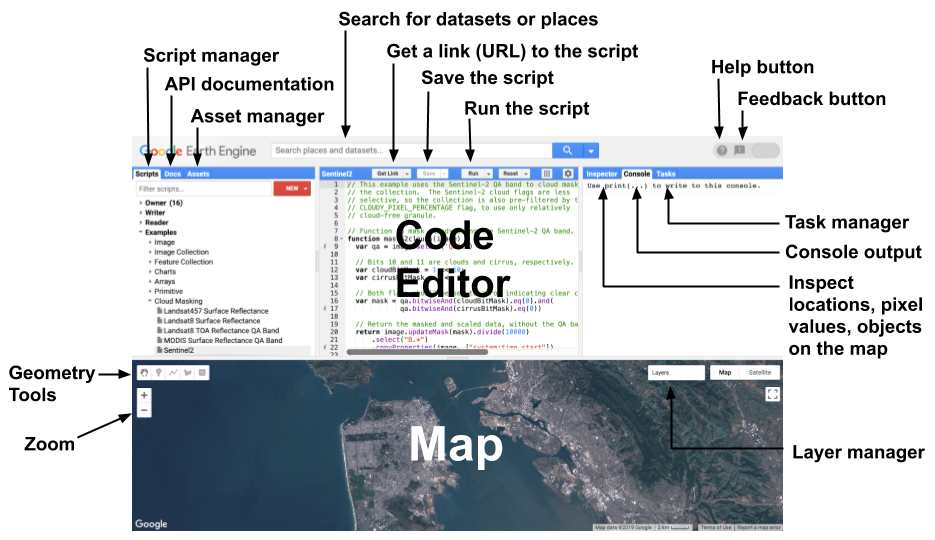
Once you have signed up for an account with GGE, you can now start playing around with satellite data using the GEE code editor. The code editor is a web-based integrated development environment (IDE) for writing and executing JavaScript code for Earth Engine. A very well documented guide for working with GEE can be found here
 Image: Diagram of components of the Earth Engine Code Editor at code.earthengine.google.com
Earth Engine Data Catalog
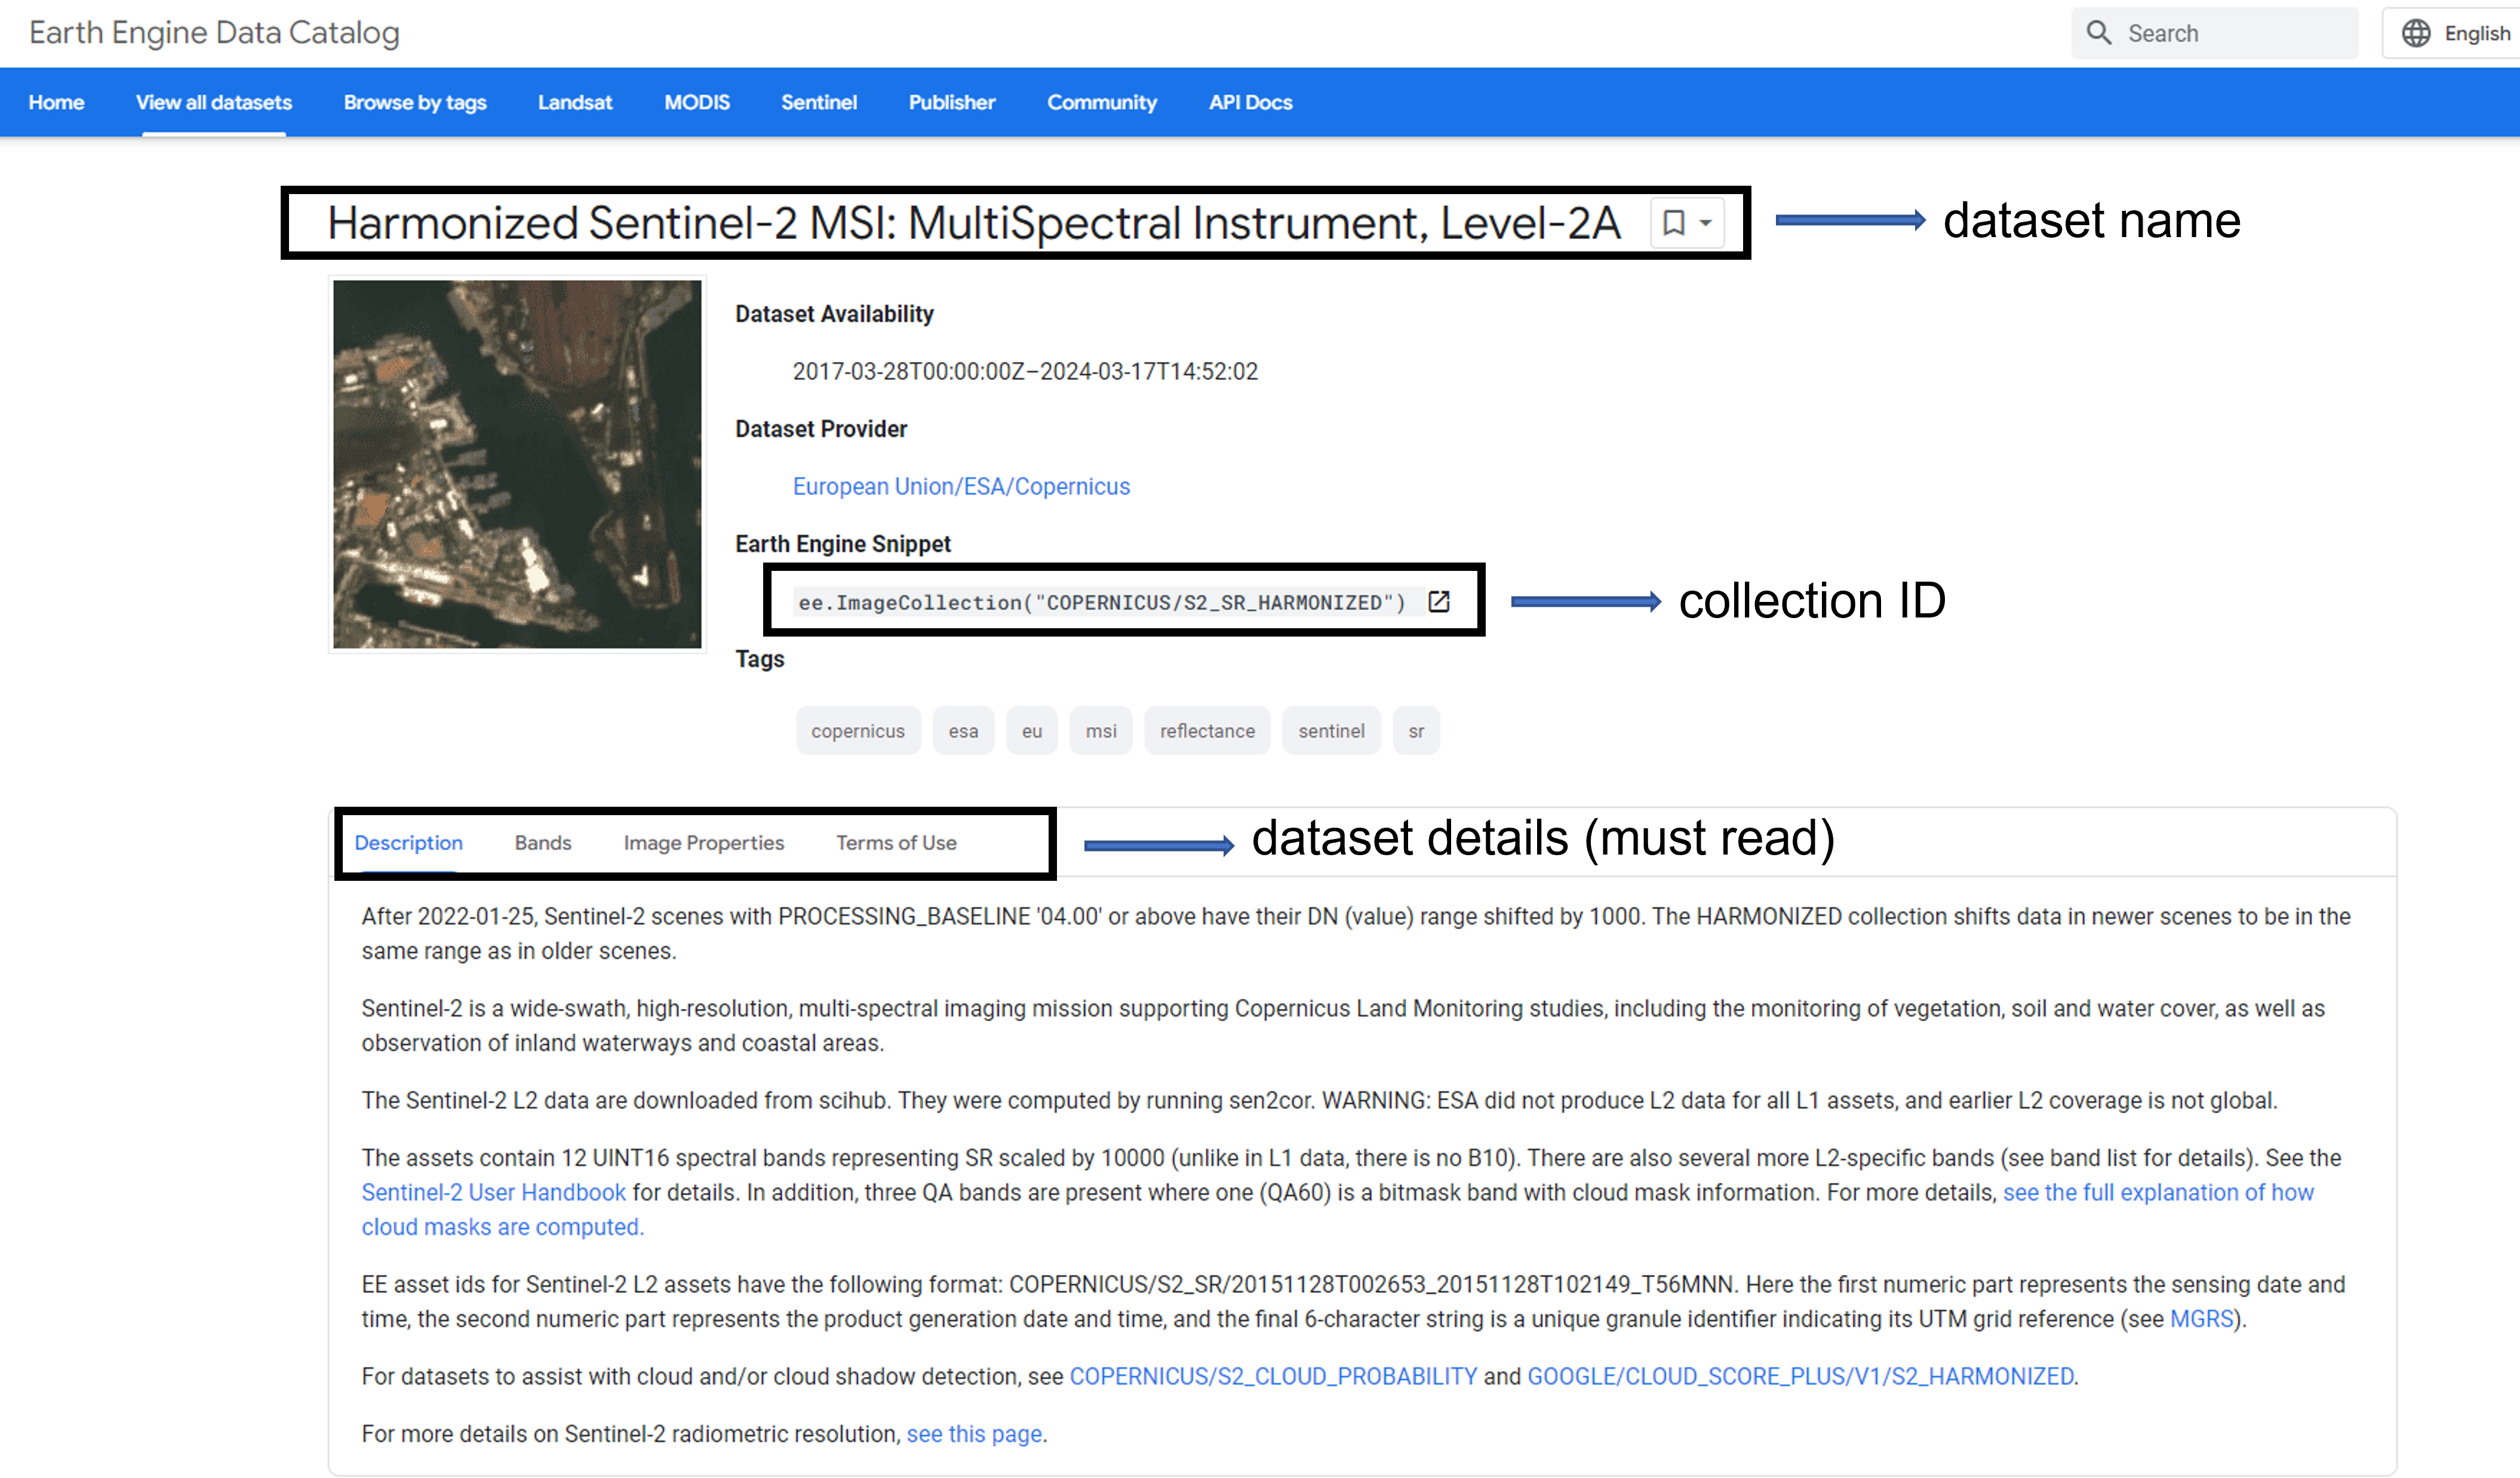
The EE data catalog provides a large variety of datasets.
 Image: Example from the catalog dataset showing details for Sentinel-2
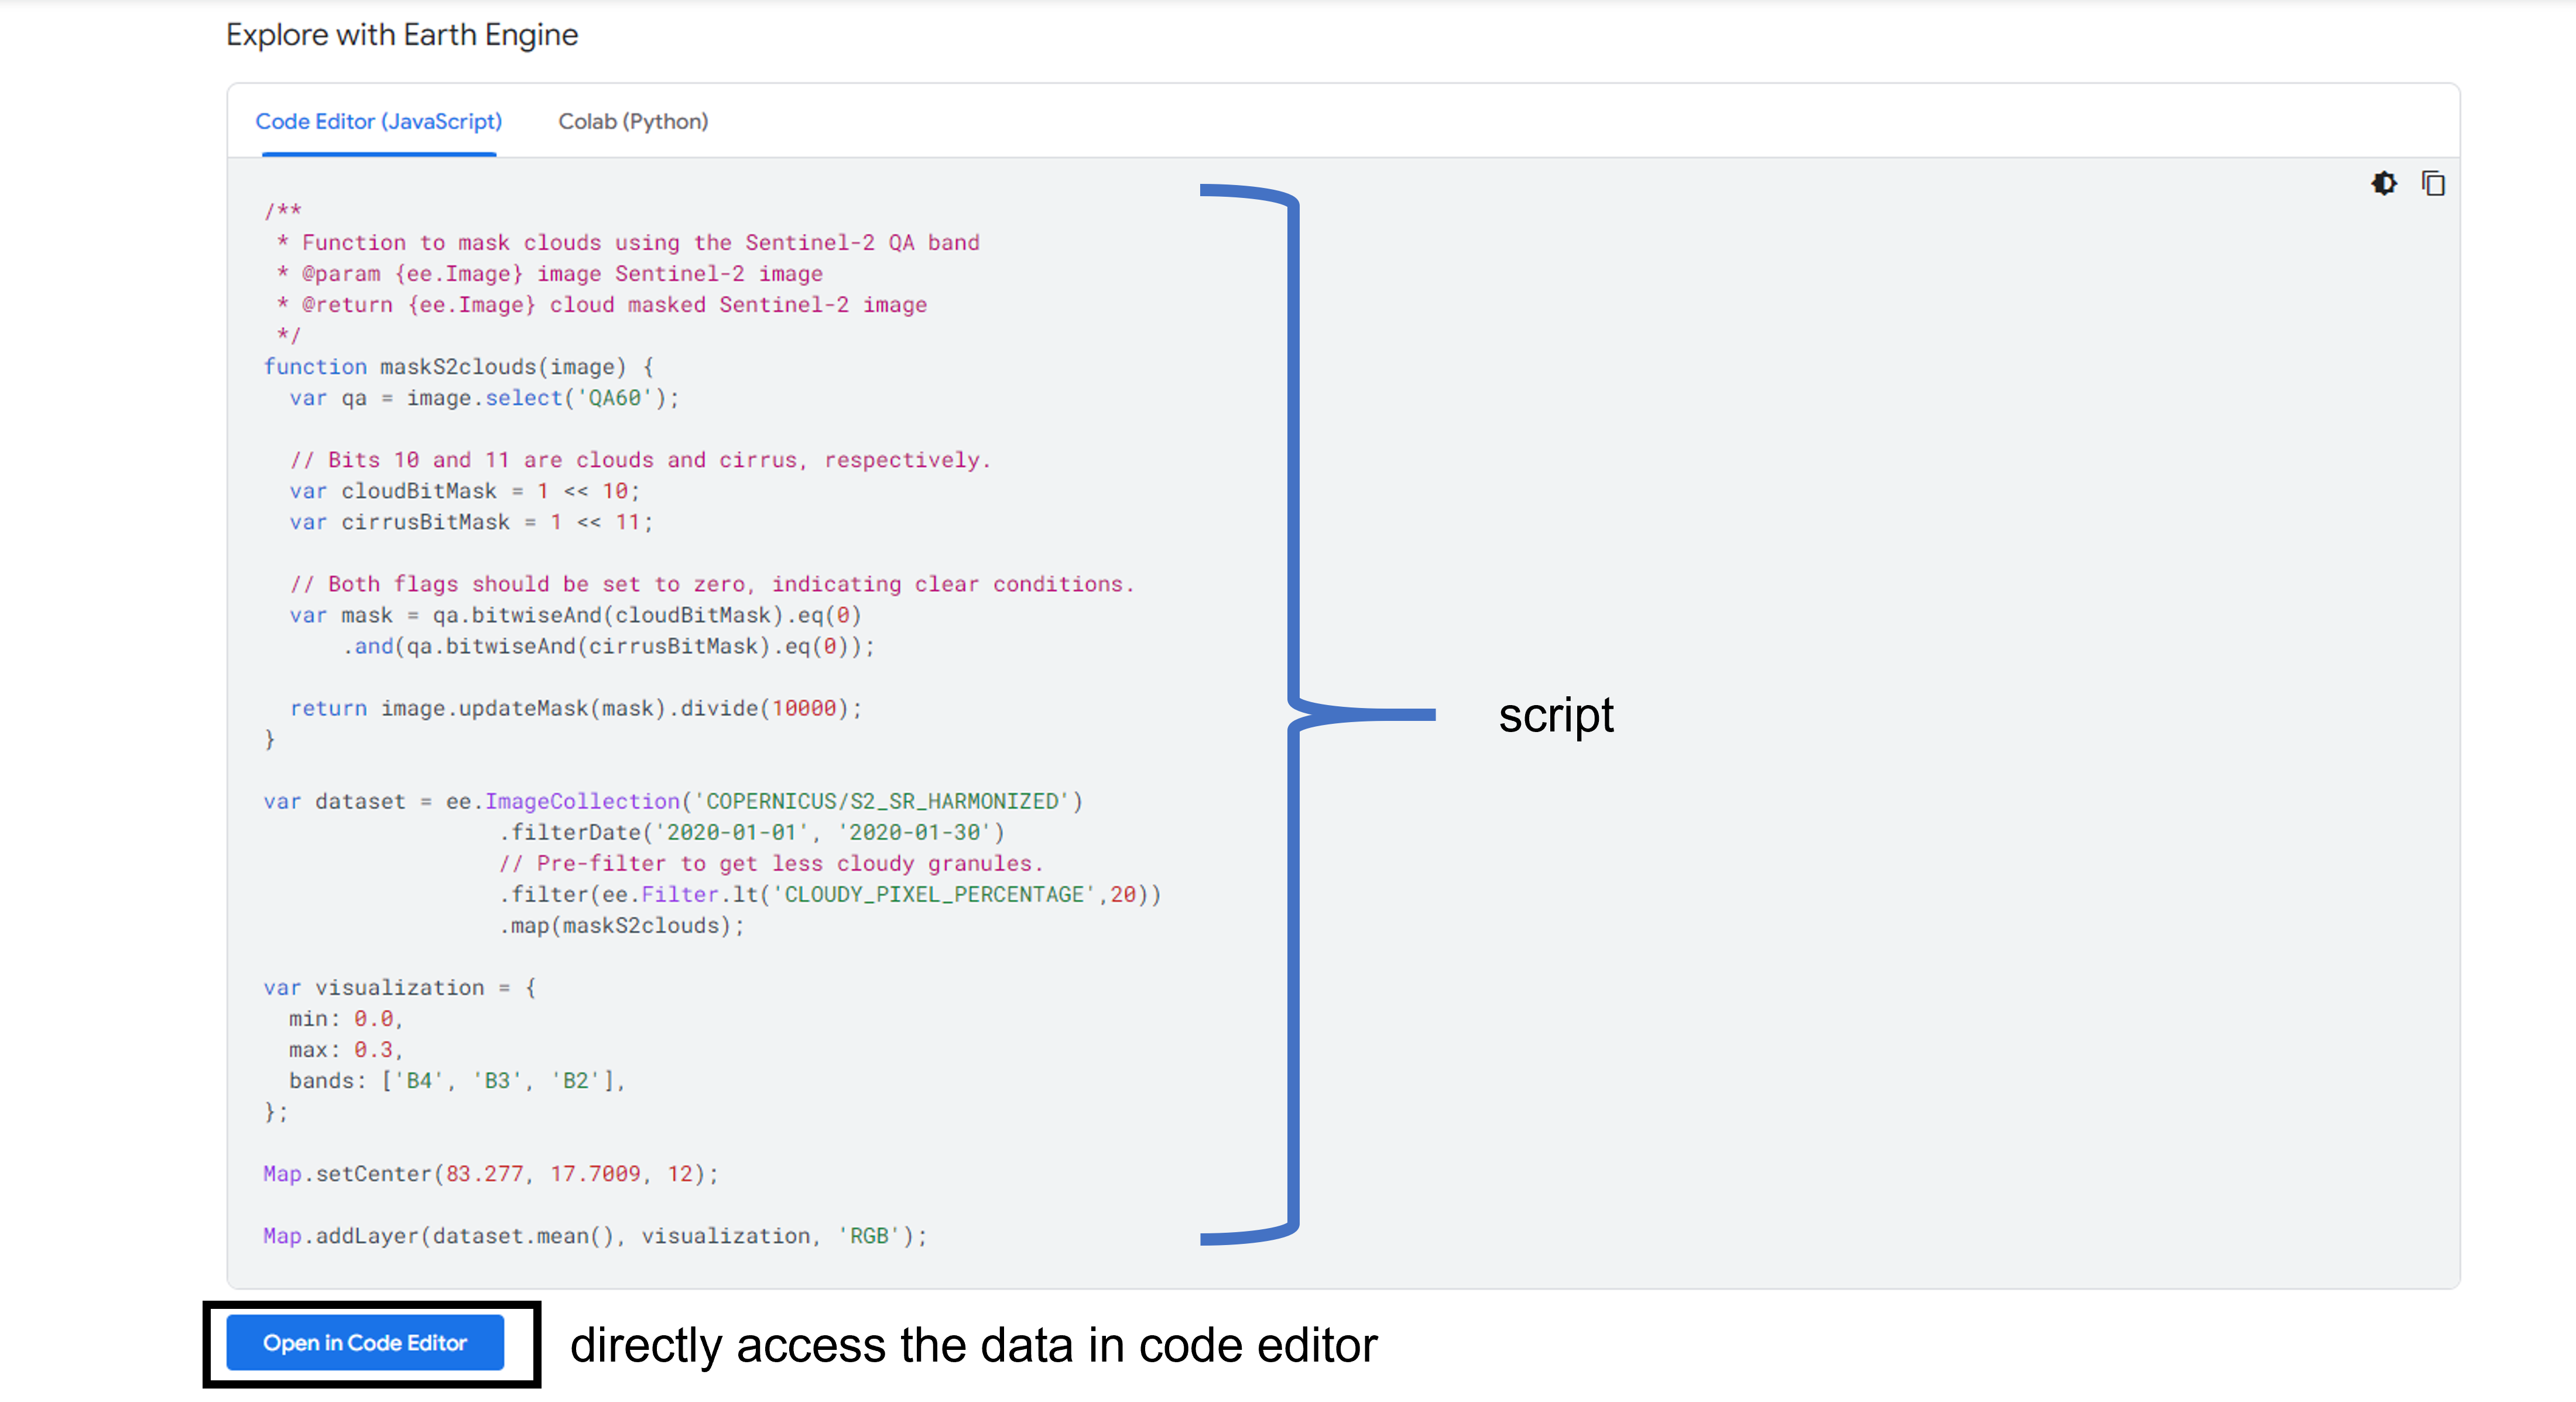
 Image: Example from the catalog dataset showing script to access Sentinel-2 data
JavaScripting with GEE
To get started with GEE we need to first learn some basics of JavaScript. Following are a few necessary functions we will need, but explore here for further functions.
- Variables: to store data values.
var city = "Moshi" - Lists: Stores multiple values in a single variable.
var cities = ['Moshi', 'Marburg'] - Objects: they store key-value pairs, where each value can be referred to by its key.
var cityData = { 'city': 'Moshi', 'coordinates': [3.3430, 37.3507], 'population_2017': 201150 }; print(cityData); - Writing a function: give input to do some computation and get a particular output
var greetings = function(name) { return 'Hello ' + name; }; print(greetings('World')); print(greetings('People')); - Loading area of study: ee.Geometry.Point(),ee.Geometry.Polygon(),ee.Feature(),ee.FeatureCollection()
var cityLocation = ee.Geometry.Point(cityData.coordinates); - Mapping
// Add the point as a layer to the map Map.addLayer(cityLocation, {color: 'blue'}, 'Moshi Location'); //Center the map on the city location Map.centerObject(cityLocation, 9); // '9' is the zoom level, you can adjust it as needed - Data Handling
- Loading datasets: ee.Image() and ee.ImageCollection()
var dataset = ee.Image('USGS/SRTMGL1_003'); // elevation raster var sentinel_collection = ee.ImageCollection('COPERNICUS/S2_SR_HARMONIZED'); - Filtering Data: filter(), filterDate(), and filterBounds()
var filteredCollection = sentinel_collection .filterDate('2020-01-01', '2020-12-31') .filterBounds(ee.Geometry.Point(cityData.coordinates)) .filter(ee.Filter.lte('CLOUDY_PIXEL_PERCENTAGE', 10)); - Image Processing: select(), median()
var selectedBands = filteredCollection.select(['B4', 'B3', 'B2']); Map.addLayer(selectedBands.median(), {min: 0, max: 3000, bands: ['B4', 'B3', 'B2']}, 'RGB Composite'); var medianComposite = sentinelCollection.median(); // Display the composite Map.addLayer(medianComposite, {bands: ['B4', 'B3', 'B2'], max: 3000}; - Exporting images
// Buffer the point to create an area for export
// The buffer size is in meters, adjust the size as needed
var bufferedRegion = cityLocation.buffer(5000); // Buffer of 5000 meters, for example
// Export script
Export.image.toDrive({
  image: medianComposite, // Replace with the image you want to export
  description: 'Sentinel2_CityLocation_Export',
  scale: 10, // Sentinel-2 typical resolution for RGB bands
  region: bufferedRegion, // Use the buffered region
  fileFormat: 'GeoTIFF',
  folder: 'GEE_Exports', // Optional
  maxPixels: 1e9 // Adjust if needed
});
