Analyse Your Temporal Data
Analyse your time series data and decompose it into seasonal characteristics and long-term trends.
Learning objectives
At the end of this session you should be able to
- explain some different strategies for time-series decomposition,
- discuss why some care should be taken in pre-processing time series prior to trend analysis,
- use e.g. linear models for explaining trends.
Time series decomposition
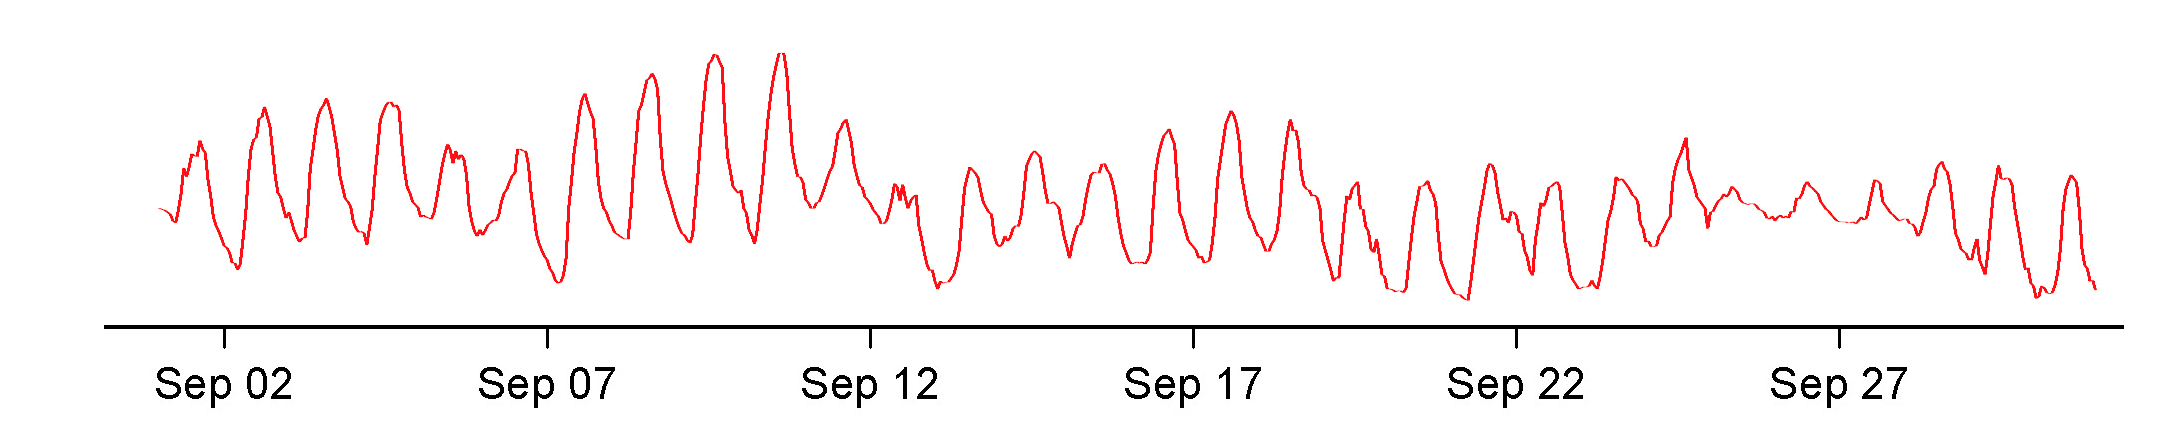
Dynamics of environmental variables are often composed of very short term, intermediate (seasonal) and long-term (trend) variations. When analysing time series data, the decomposition into the respective components offers insights into driver-response relationships as basis for further analyses.
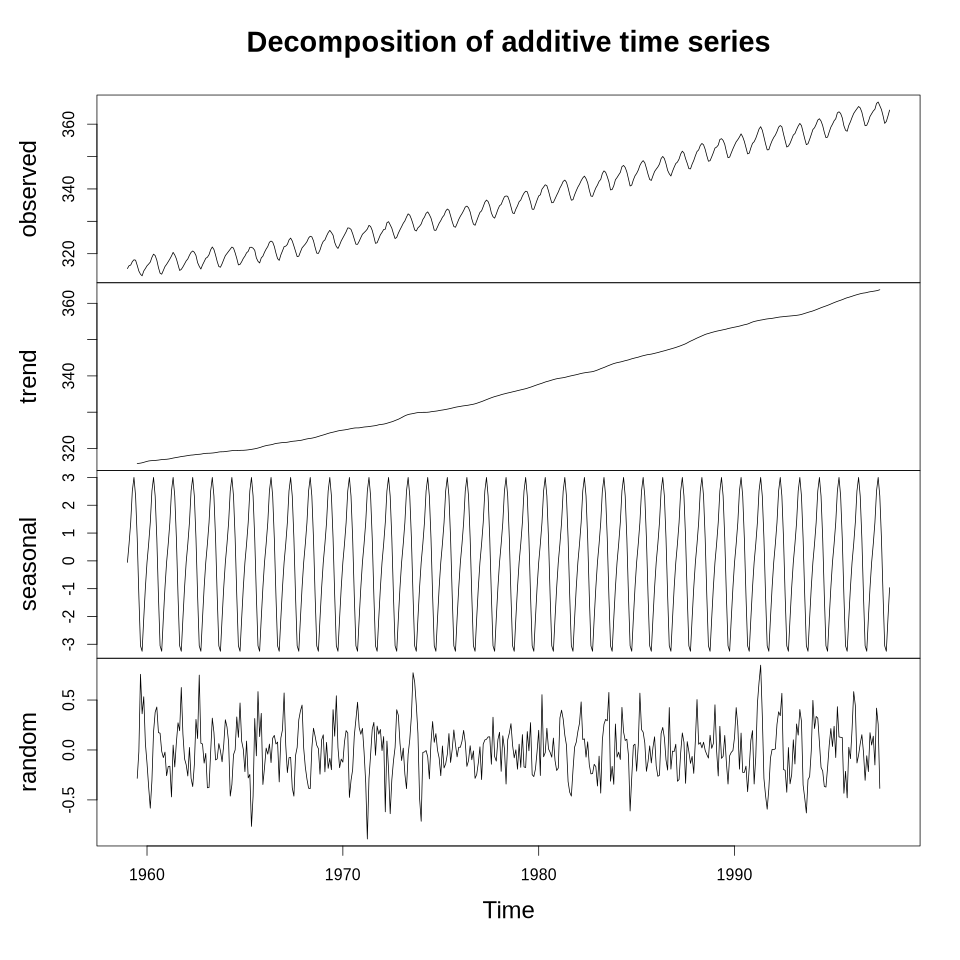
The above graphic shows the decomposition of the CO2 dataset from R’s forecast library (Mauna Loa atmospheric CO2 concentration).
Comments?
You can leave comments below if you have questions or remarks about any of the text or code in this unit. Please copy the corresponding line into your comment to make it easier to answer your question.