SDM workflow I - overview
All SDM approaches have a similar generic workflow as outlined by Zurell et. al 2020:

In the first phase, the conceptualization phase, you should determine what model you want to use, what kind of data you have available and if it is fitting for your modeling purpose. Think about the location of your study area the scale and the species and then write down a concept for your project.
The second step is to gather data on species occurrences and environmental variables. This involves in some cases actual field surveys to observe and record where the species is found, but there is also a lot of species occurrence data around for example it can be found on gbif. It also includes reviewing existing scientific literature and obtaining relevant environmental data, such as temperature, precipitation, vegetation cover, and elevation, from sources like remote sensing imagery or climate databases. Once the data is collected, it needs to be processed and prepared for analysis. This step involves cleaning the data by checking for errors, inconsistencies, and missing values. Data standardization may be necessary to ensure that all variables are in a consistent format. In the next step a model is fitted to upscale the species occurrences with the environmental variables. Several modeling algorithms are available, such as MaxEnt, Random Forest, or generalized linear models. The choice of the model depends on the characteristics of the data, the research question, and the assumptions of the model. It is essential to consider both the predictive performance and the ecological interpretability of the selected model. One of the most important steps is the selection of model parameters. Don´t just skip over it and use the default parameters but think carefully of what might need to be tuned and also about a fitting validation strategy.
The performance of the model is then evaluated using various metrics such as area under the receiver operating characteristic curve (AUC-ROC), true skill statistic (TSS), or cross-validation techniques. For more evaluation metrics for species distribution models have a look at the paper by Konowalik & Nosol 2021.
After the model is trained and evaluated, it can be used to predict species distributions in new areas or under different environmental conditions. This step involves applying the model to spatially explicit environmental data and generating maps or spatial predictions of species occurrence probabilities. The results can be interpreted to gain insights into the ecological factors influencing the presence or absence of the species. This step often involves considering the limitations and uncertainties associated with the modeling process and validating the predictions using independent datasets or additional field surveys.
R packages for SDM
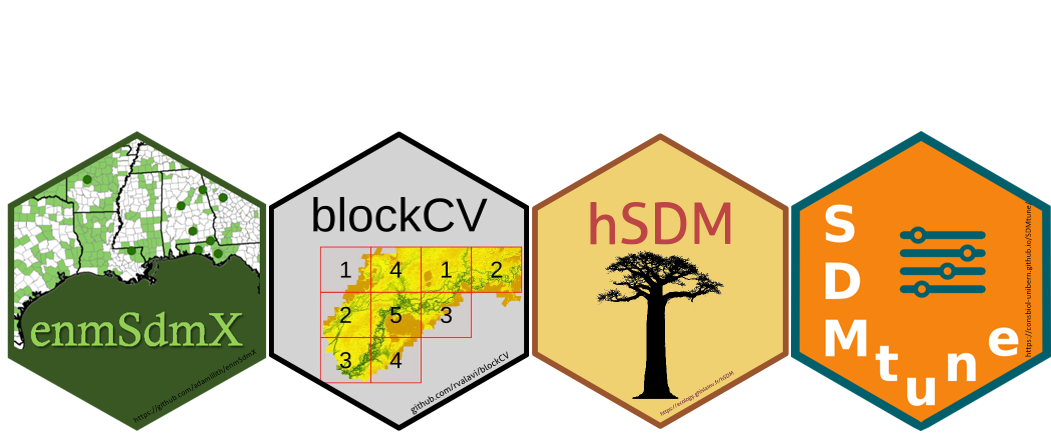
R provides a wide range of packages specifically designed for handling species occurrence data, environmental variables, and modeling techniques. For instance, packages like dismo and terra offer functionalities for data manipulation, spatial analysis, and visualization. Additionally, R supports popular modeling algorithms used in species distribution modeling, such as MaxEnt (dismo), random forests (R package randomForest), and generalized linear models. Furthermore, R facilitates model evaluation and interpretation through packages like Metrics and BIOMOD2 for ensemble modeling. The vast collection of packages in R makes it a flexible and powerful language for conducting species distribution modeling.
However, the extensive range of packages available in R for species distribution modeling can also be overwhelming and confusing. It may require some time and effort to navigate through the various packages, understand their functionalities, and determine which ones are most suitable for specific modeling tasks. This study by Sillero et al. 2023 highlights the strengths and limitations of the various R packages and groups them by purpose that they were built for. In total over 60 packages were reviewed and a comprehensive list of the packages and there purpose can be found here you can use it to get an overview over the packages or search for one you can use in your student tutorial.