
Audio
A theory of sound
Acoustic sensors, such as microphones or hydrophones, record sounds produced by animals, including vocalizations, mating calls, and other bioacoustic signals. Basically, what a microphone does is convert sound into a small electrical current through a diaphragm that vibrates when it’s hit by the sound wave. This movement then affects a magnet near a coil, or vice versa, creating the electrical current. Carl R. Nave has a wonderful technical drawings which explain it in detail, here.
The sound waves travel through a medium, typically air, but they can also propagate through liquids and solids. They are created by the vibration of an object, such as vocal cords which causes the particles in the surrounding medium to oscillate and transmit the energy of the vibration. The important characteristics of a sound wave are frequency, amplitude and wavelength.
Frequency refers to the number of one complete waves (with one negative and one positive alternation) that occur per unit of time and is measured in Hertz (Hz). Frequency determines the pitch of the sound, with higher frequencies corresponding to higher pitches and lower frequencies corresponding to lower pitches. Amplitude refers to the magnitude or intensity of the sound wave, which corresponds to its loudness or volume. It is measured in decibels (dB). Higher amplitudes produce louder sounds, while lower amplitudes produce softer sounds. Wavelength is the distance between successive points of the same phase in a wave, such as from one peak to the next peak or from one trough to the next trough. It is inversely proportional to frequency, meaning higher frequency waves (=higher pitches) have shorter wavelengths and vice versa.
Animal vocalizations typically exhibit distinctive spectral characteristics, where these three characteristics are moduled. For example, a bird might start its song with low-frequency notes, gradually increasing the amplitude. As the song progresses, the bird may transition to higher frequencies and full amplitude. Analyzing these spectral features can help differentiate between different species or even in some instances individual animals.
Once recordings are made, researchers analyze the audio data using specialized software capable of detecting and classifying sounds of interest. This process often involves the use of machine learning algorithms trained to recognize specific animal vocalizations based on their acoustic features.
Have a look at this brilliant video by Alison Styring, which exemplifies the aforementioned principles1:

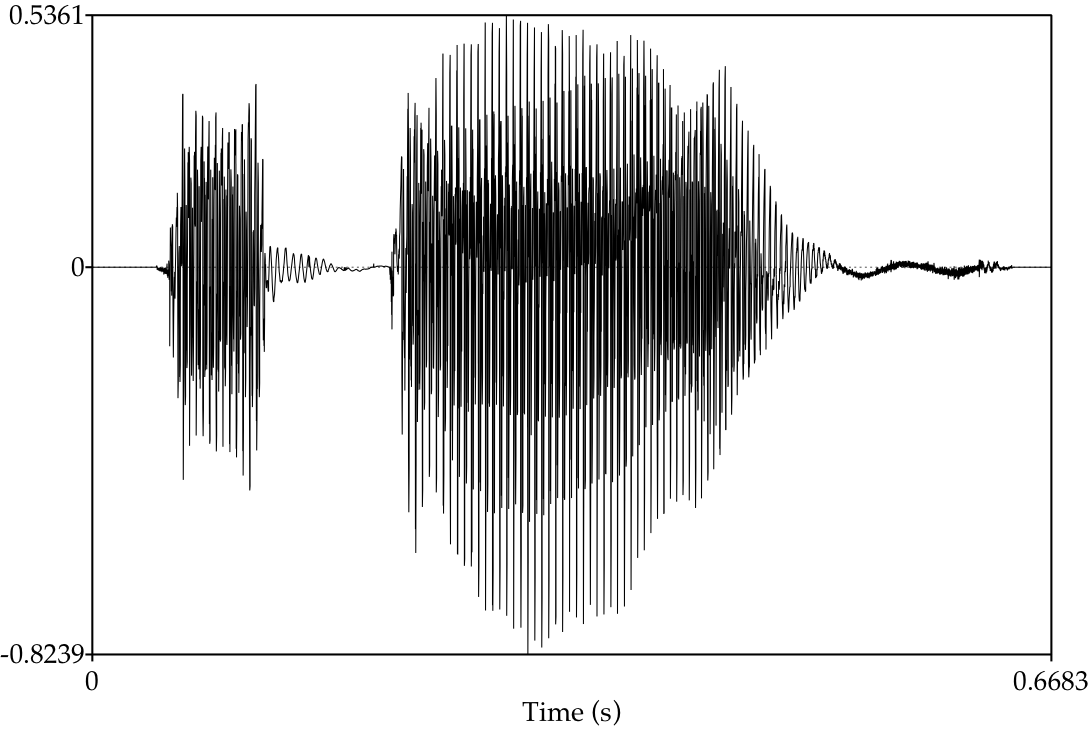
There are two ways in which one can graphically represent sound. A waveform or time-domain plot displays the amplitude of a sound signal over time. It provides a visual representation of the temporal characteristics of a sound signal. It is useful for analyzing features such as the duration of sounds, temporal patterns, and the presence of individual sound events within the signal.
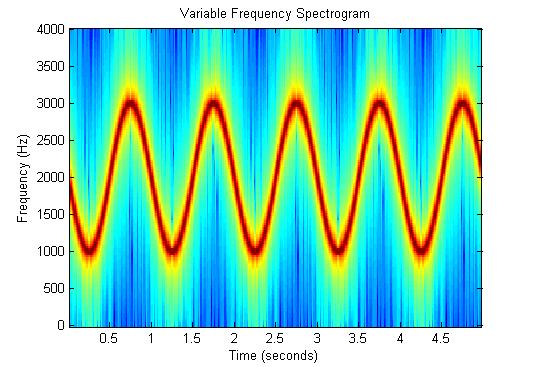
An audiospectrogram, also known as a spectrogram or frequency-domain plot, provides a more detailed analysis of the frequency of a sound signal over time. Audiospectrograms are valuable for analyzing the spectral characteristics of sound signals, including the distribution of energy across different frequency bands, the presence of harmonics or overtones, and the occurrence of frequency modulations or shifts
Autonomous sound recording
Autonomous Recording Units (ARUs) are typically equipped with microphones capable of capturing sounds within a specific frequency range. These microphones can vary depending on the application, with omnidirectional or directional microphones being commonly used.
Excursion: Bat calls and recording thereof
Humans can perceive approximately up to 20 kHz. However, most bats call in a frequency range that is significantly higher - up to 160 kHz! This is why the human ear cannot perceive most calls (with the exception of “deep-voiced” species such as Nyctalus noctula). To make these calls audible nevertheless, there are so-called bat detectors. Bat recorders are equipped with special microphones that are able to record ultrasonic frequencies in the range from typically 15 kHz to over 100 kHz. Modern bat recorders often save the recordings in a digital format such as WAV or MP3 on memory cards. After recording, the data is often passed through filtering and processing algorithms to reduce background noise and filter out the bats’ ultrasonic calls.
To make the ultrasonic calls audible to humans, it must be converted it into the audible range. This can be done by down-sampling (reducing the frequency), time stretching (slowing down the playback speed) or heterodyne (overlaying the ultrasonic frequency with an audible carrier frequency). The latter is probably the most common variant, which is explained here step by step:
Heterodyning combines the ultrasonic frequency of the bat call with a constant frequency. This combination results in two new frequencies: the sum of the two frequencies and the difference between them. When the frequency of the local oscillator is close enough to the frequency of the bat call, the difference frequency falls within the audible range, making it perceivable to humans. When the oscillator frequency is set too low, the resulting difference frequency might be too low for human hearing, resulting in a very quiet or inaudible signal. Conversely, if the oscillator frequency is set too high, the resulting difference frequency might be too high for human hearing, also resulting in a quiet or inaudible signal. The oscilliator must thus be adjusted constantly to “scroll” through the frequencies of interest.

Want to build your own? Check the bat pi project
SPOILER
Human point counts include visual detections, which are beneficial but often under-reported in studies comparing point counts with ARUs. On the other hand, humans may introduce an avoidance effect that affects bird detections, especially when multiple observers are present. In addition, humans may miss some birds, especially during dawn chorus or due to human error, whereas recordings can be replayed, re-analyses and have the advantage of being verifiable by other people [^3]. - A qualitative call recording is stronger evidence than someone claiming to have heard a particular species.