| EX | Deriving LiDAR products |
Exercise: LiDAR products
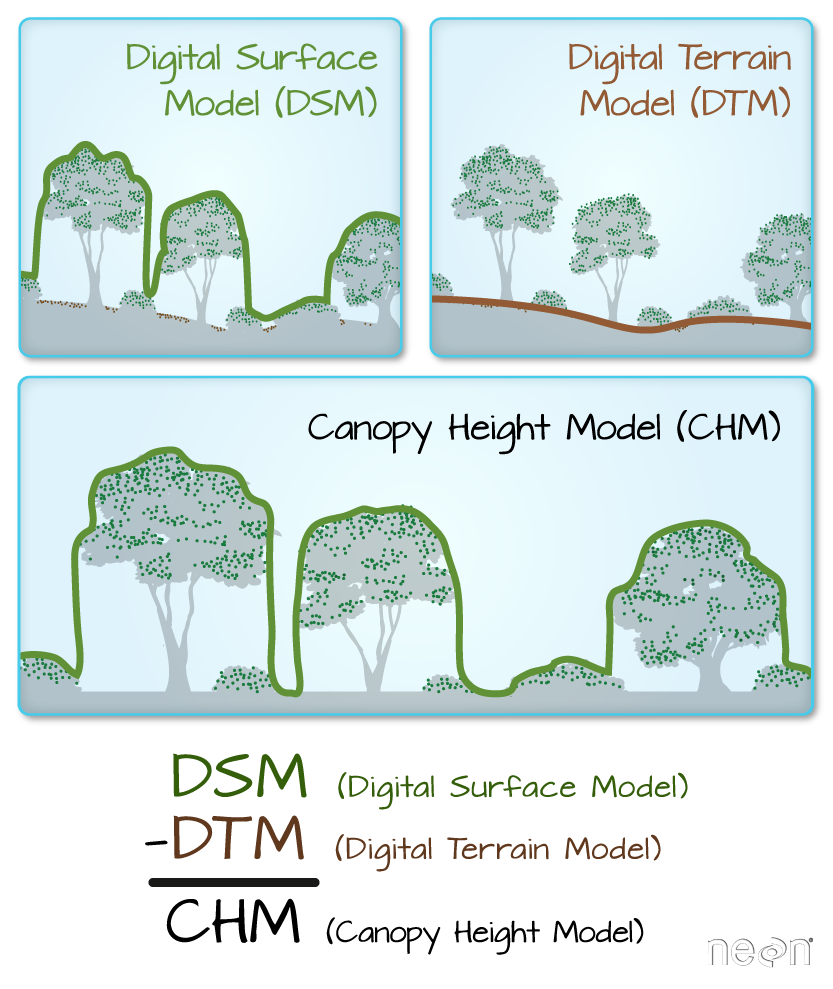
In this exercise, we want to derive the most common LiDAR products DTM (Digital Terrain Model), DSM (Digital Surface Model) and CHM (Canopy Height Model).

Rasterizing the point cloud
Since the point clouds are 3D, to get DTM, DSM and CHM, we need some sort of grid to rasterize this point cloud. Of course lidR provides the functions for these tasks. Have a look at rasterize_terrain(), rasterize_canopy() or the more flexible pixel_metrics().
Note- The function grid_metrics() was updated to three new functions cloud_metrics(), pixel_metrics(), and crown_metrics() and the function grid_terrain() was updated to rasterize_terrain().
Task 1
- Load the flm1_clipped.las file that you saved earlier.
- Calculate DTM, DSM and CHM with 10m resolution.
- Save your rasters as a tif file.
# the following is a guiding snippet
## load the clipped lidar file

flm1_clipped <- readLAS("./data/flm1_clipped.las")

## calculate dtm, dsm and chm

##### DTM

#flm1_clipped <- classify_ground(flm1_clipped, algorithm = pmf(ws = 5, th = 3)) #step to classify ground points based on Progressive Morphological Filter
plot(flm1_clipped, color = "Classification", size = 3, bg = "white")

# DTM can be created using different algorithms
#1. Kriging
dtm_kriging <- rasterize_terrain(flm1_clipped, res = 10, algorithm = kriging(k = 40))
plot_dtm3d(dtm_kriging, bg = "white")

#2. Invert distance weighing
dtm_idw <- rasterize_terrain(flm1_clipped, res = 10, algorithm = knnidw(k = 10L, p = 2))
plot_dtm3d(dtm_idw, bg = "white")

### DSM
# Hint- Use function rasterize_canopy() with algorithm dsmtin()

# CHM
# Hint - Normalize the point clouds and then use rasterize_canopy()
Task 2
We want to calculate what the mean vegetation height of our forest plot is.
- Load the cropped Sentinel-2 scene from the previous session
- Crop the scene for our forest plot
- Calculate a DEM with the Sentinel tile as a grid template with pixel_metrics()
- Normalize the point cloud with normalize_height(). What happened?
- Calculate the mean vegetation height for each pixel
- Save the mean vegetation height as a tif file
- Plot the mean vegetation height as overlay to the forest Sentinel scene
Comments
You can leave comments below if you have questions or remarks about any of the text or code in this unit. Please copy the corresponding line into your comment to make it easier to answer your questions.
