
Example: Colours and maps
This is a short example on how to use the hcl colour palette for colouring features of a shapefile.
Set up
# Load the required packages
library("terra")

# Clean the workspace first
rm(list=ls())

# Get helper function from the previous page
clrs_hcl2 <- function(n) {
  hcl(h = seq(0, 260, length.out = n),
      c = 60, l = seq(10, 90, length.out = n),
      fixup = TRUE)
}

## Set seed to get the same results every time
set.seed(42)
Download world map as an example
Download the data here or directly from within R.
download.file("https://naciscdn.org/naturalearth/50m/cultural/ne_50m_admin_0_countries.zip",
             destfile = "countries.zip")
NaturalEarthData has a nice collection of other free GIS data, too.
Plot with random numbers
## Read in shapefile
world <- terra::vect("countries/ne_50m_admin_0_countries.shp")
## Generate random numbers that follow a normal distribution for each feature in the map
randomNumbers <- rnorm(nrow(world), 50, 16)
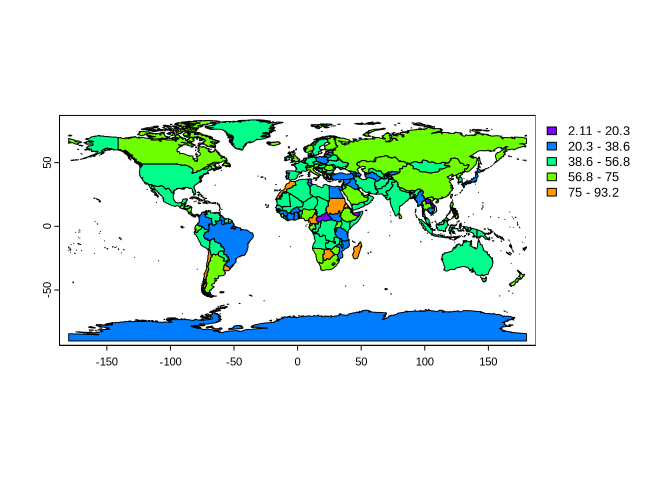
## Plot using the random numbers
plot(world, values = randomNumbers)
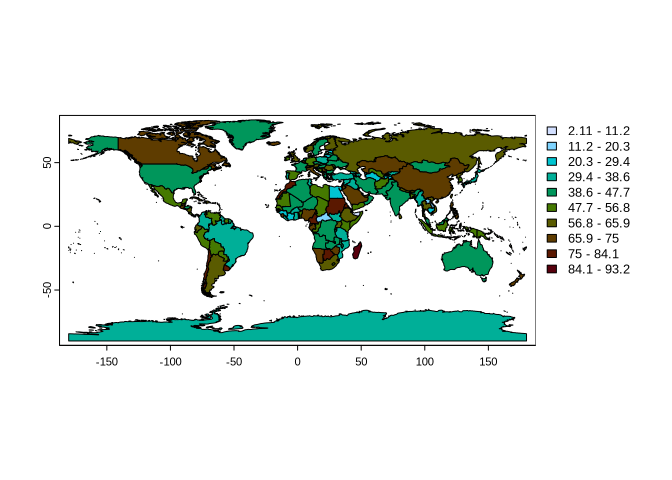
Plot with 10 hcl colour classes
We would like to have 10 hcl colour classes. This can be achieved by adjusting the breaks (number of breaks) and col (colour) parameters.
myColours <- rev(clrs_hcl2(10))
map <- plot(world, values = randomNumbers, breaks = 10, col = myColours)
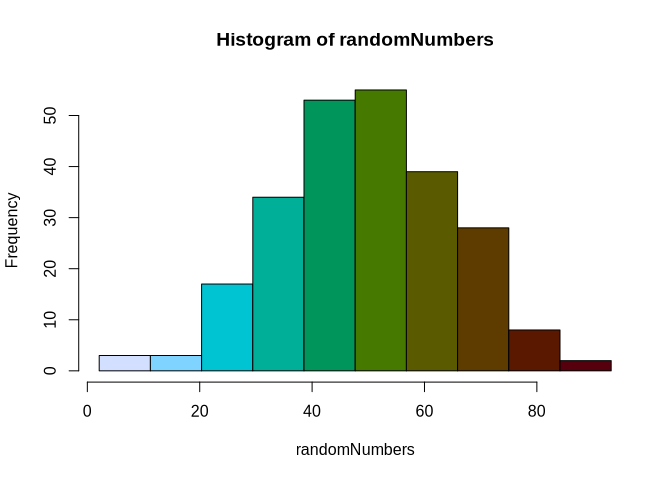
Equal interval breaks are used by default. The frequency of observations within each colour class is shown below.
hist(randomNumbers, breaks = map$breaks, col = myColours)
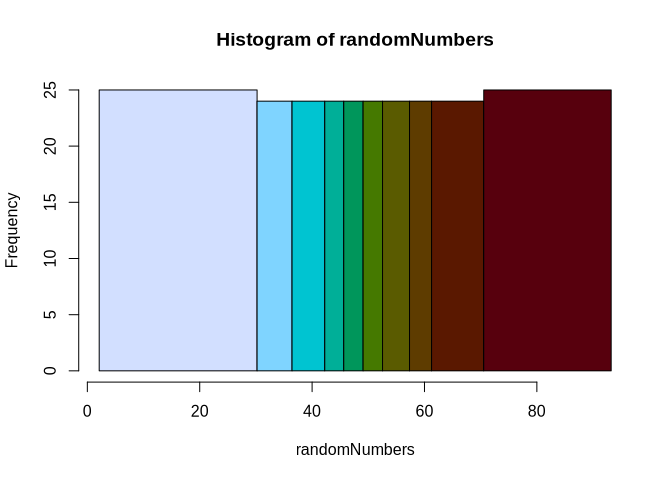
Plot with equal count breaks
In the above map, some colours appear more often than others. If we want every colour to appear about the same number of times, we can change the breakby parameter to get equal count breaks.
map <- plot(world, values = randomNumbers, breaks = 10, col = myColours, breakby = "cases")
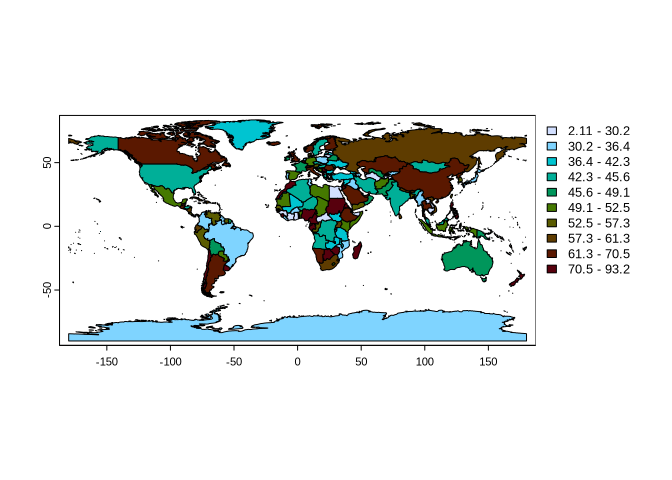
The frequency of observations within each colour class is now about the same.
hist(randomNumbers, breaks = map$breaks, col = myColours, freq = TRUE)
Save information in map
We can save the random numbers and the colour information in the map for later use.
world$randomNumber <- randomNumbers
world$randomNumberColour <- myColours
terra::writeVector(world, "a whole new world.shp", overwrite = TRUE)