
Predict your linear data
Compute simple linear models to predict dependent data and assess the performance with independent test samples.
Learning objectives
At the end of this session you should be able to
- evaluate the prediction performance of a statistical regression model,
- decide which cross validation strategy to use, and
- compute and interpret some prediction error metrics.
Basic idea of statistical prediction
Use observation samples to build a model, which predicts the dependent variable based on one or more independent variables.
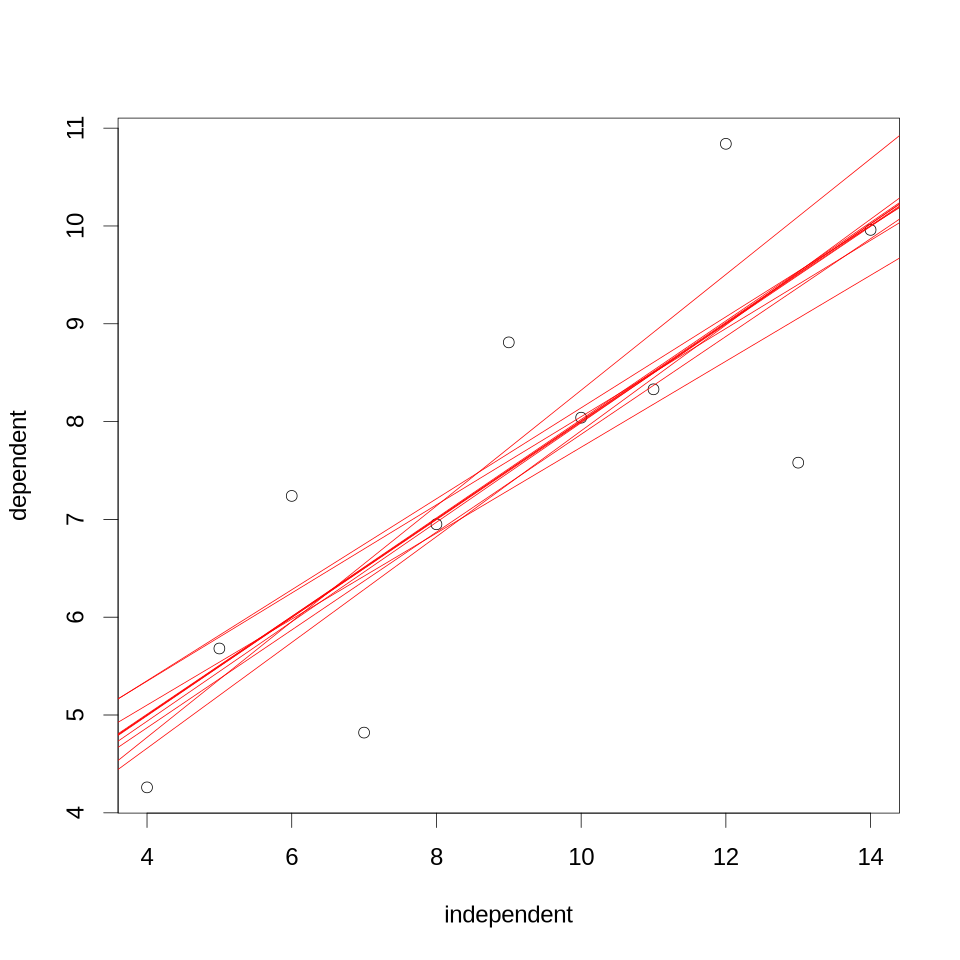
The graphic above shows a scatter plot of data pairs between an independent (X axis) and a dependent (Y axis) variable. The red lines represent linear regression models, each computed on a different subset of the data pairs where one data pair has been removed. The difference between the left-out observation and its prediction by the model provides an estimate for the error of the model predictions. Such an error estimation strategy is generally called (leave-one-out) cross validation.
Have a look at this video for getting started with the basic concepts of cross validation.
For a deeper look into cross validation strategies related to spatially and temporally dependent data, have a look at Meyer et al. 2018.
Comments?
You can leave comments below if you have questions or remarks about any of the text or code in this unit. Please copy the corresponding line into your comment to make it easier to answer your question.