
Basic idea of statistical modeling
Basic idea of statistical modeling
Use observation samples to describe the relationship between a dependent variable and one or more independent variables.
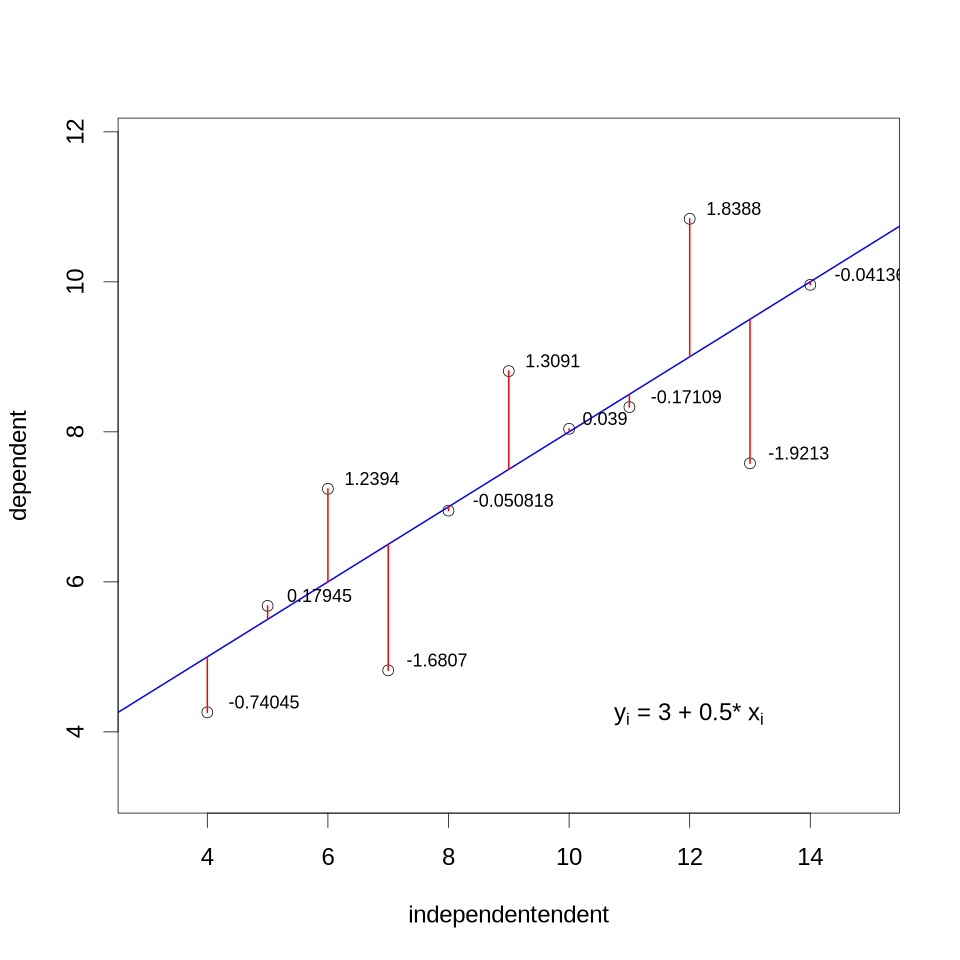
The graphic above shows a scatter plot of data pairs between an independent (X axis) and a dependent (Y axis) variable. The relationship is estimated by a linear regression model illustrated by a blue line. The model coefficients are given in the equation. Residual values are additionally indicated by red lines.
Linear regression 101
Using statistical models for relating independent and dependent variables in order to describe relationships between the recorded data pairs or predict (interpolate) values in a range where no data pairs have been observed is a key method in environmental sciences. A bivariate linear regression model is the simplest form of such a statistical model. However, if the quality of a linear regression model is assessed by the commonly computed internal test statistics (e.g. p-values, t-test, R-squared), the following aspects have to be kept in mind (Y is the dependent, X the independent variable):
- Linear regression models are only appropriate for linear relationship between independent and dependent variables.
- Residuals of linear regression models must be normality distributed, which is equivalent to the normal distribution of Y at each observation X (and which is not equivalent to the common statement that X and Y must be normally distributed).
- The variance of the linear regression residuals must be homogeneous (i.e. homoscedasticity), which is equivalent to the homogeneity of the variance of Y at each observation X.
- The residuals of the linear regression model must be independent, which is equivalent to the independence of Y for different observations X.
- The values of X must not be random but are exact or show only a very small noise compared to Y.
- If more than one independent variable is used in the model (i.e. multiple linear regression), each independent variable must not be a linear combination of other one or more other independent variables (i.e. no multicollinearity).
Note that the commonly computed test statistics do not have any meaning for using linear regression models to predict data but only to describe a relationship between the known observations.
Linear regression kick off
To get an overview about linear regression, you can watch the videos below or do some internet research on your own. There are some great tutorials out there.
Try to answer the following questions:
- What is a linear regression and how does it work?
- What types of sum of squares can be calculated and why are they important?
- What are p and r2 values?