Exercise: LiDAR products
DEM, DSM, CHM
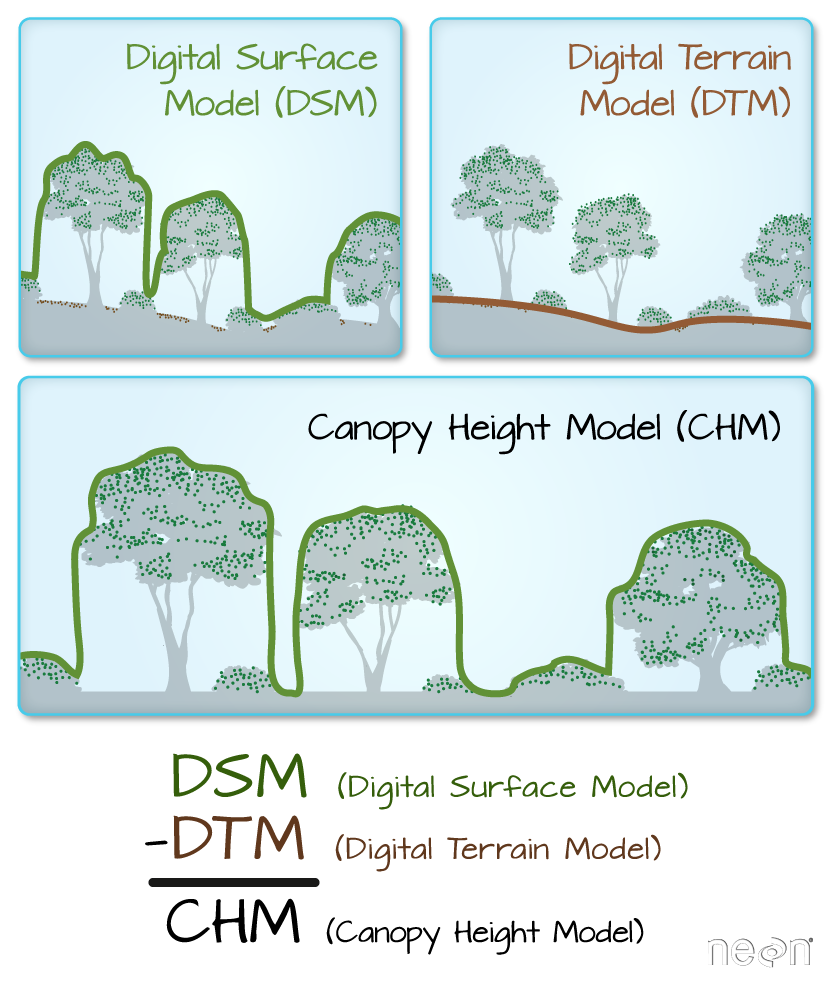
In this exersice we want to calculate three of the most common LiDAR products: the Digital Elevation Model, the Digital Surface Model, and the Canopy Height Model.
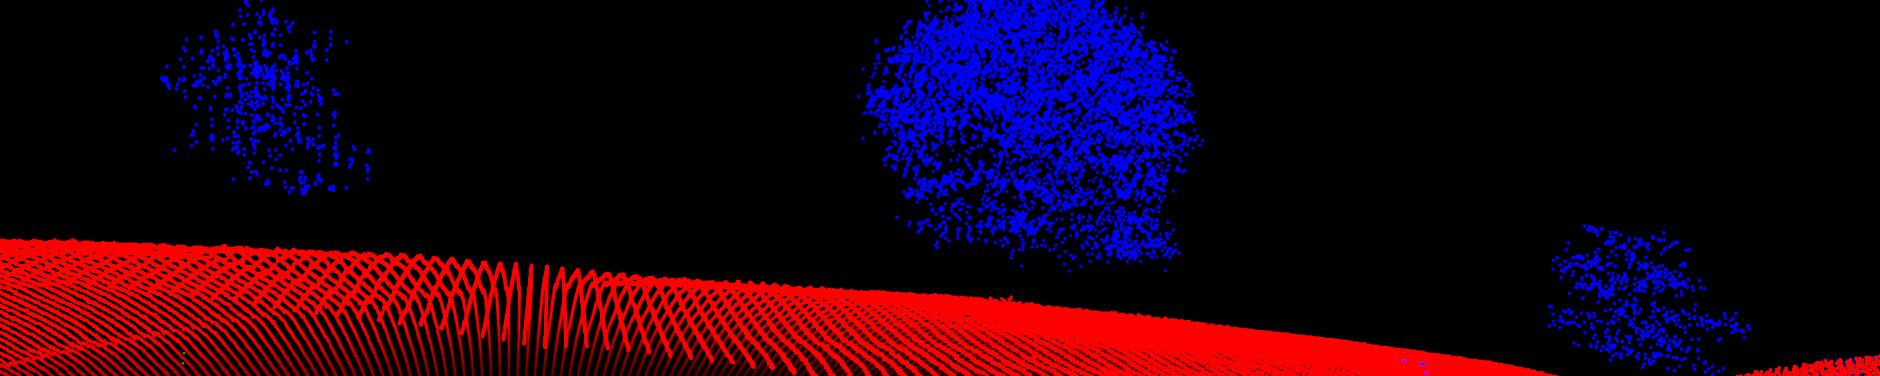
 source: https://www.earthdatascience.org/images/courses/earth-analytics/lidar-raster-data-r
We already learned that it is possible to derive a DEM from LiDAR data by filtering out the ground points. What attribute of the LAS file could we use to create the DSM?
Of course, we eventually need some sort of grid to rasterize the pointcloud.
Of course lidR provides the functions for these tasks. Have a look at rasterize_terrain() and rasterize_canopy().
Tasks:
- Calculate a DEM, DSM and CHM with a 1 m resolution
- Plot the DEM, DSM and CHM
- Save the CHM as a tif file
Mean vegetation height
The Sentinel grid topography will now be the basis for the calculation of the mean vegetation height, which we already encountered in Baessler et al. 2010.
Tasks:
- Load the first layer of the cropped Lahntal Sentinel-2 scene
- Crop the layer with the extent of the LiDAR pointcloud
- Calculate a DEM with the Sentinel tile as a grid template with
rasterize_terrain() - Normalize the pointcloud with
normalize_height(). What happened? - Calculate the mean vegetation height for each pixel
- Save the mean vegetation height as a tif file
- Plot the mean vegetation height as overlay to the Lahntal sentinel scene
Uploading assignment to Ilias
Finalize the three assignments (i.e., answering the questions under the reading assignment, and the two exercises under Introduction to LidR and LiDAR products) and create an HTML file from your Rmd file by knitting it. Then upload both files (i.e., Rmd and html) to Ilias. See here for where exactly to place your files as well as for the file naming conventions.