Exercise: Introduction to LidR
Data acquisition
Please download “Lidar Data Lahntal” from the Ilias course directory “data” and save it in your project structure. It may be advisable to create a subdirectory in your data folder for all the upcoming LiDAR processing.
LidR
- If not already done, install the
lidRpackage - Load the Lahntal LiDAR data into R
Visual data exploration
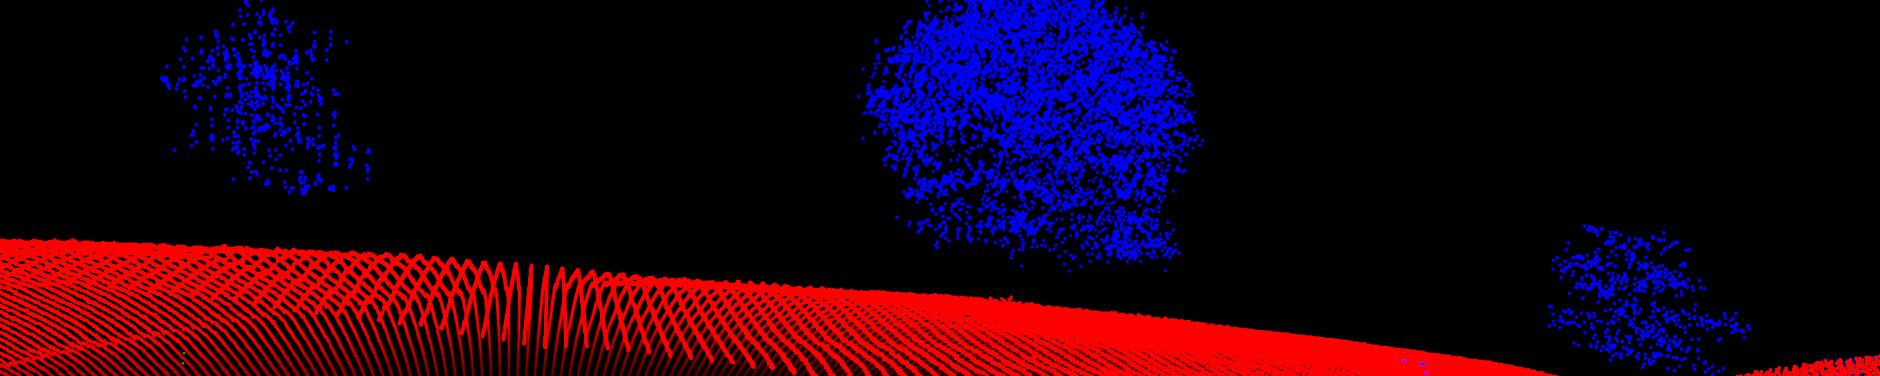
- Plot the LiDAR data
- Plot the LiDAR data again, but experiment with different columns for the coloring of the points
- What information could you gain from these plots?
Attribute Filter
- Filter the LiDAR data. Only keep points below an intensity value of 300
- Plot them. What points are these? What could you do with those points?