10 Overview
Transform to 3D, visualization and interpretation of results
Overview
Why to investigate and what can we find out about the ground?
Applications
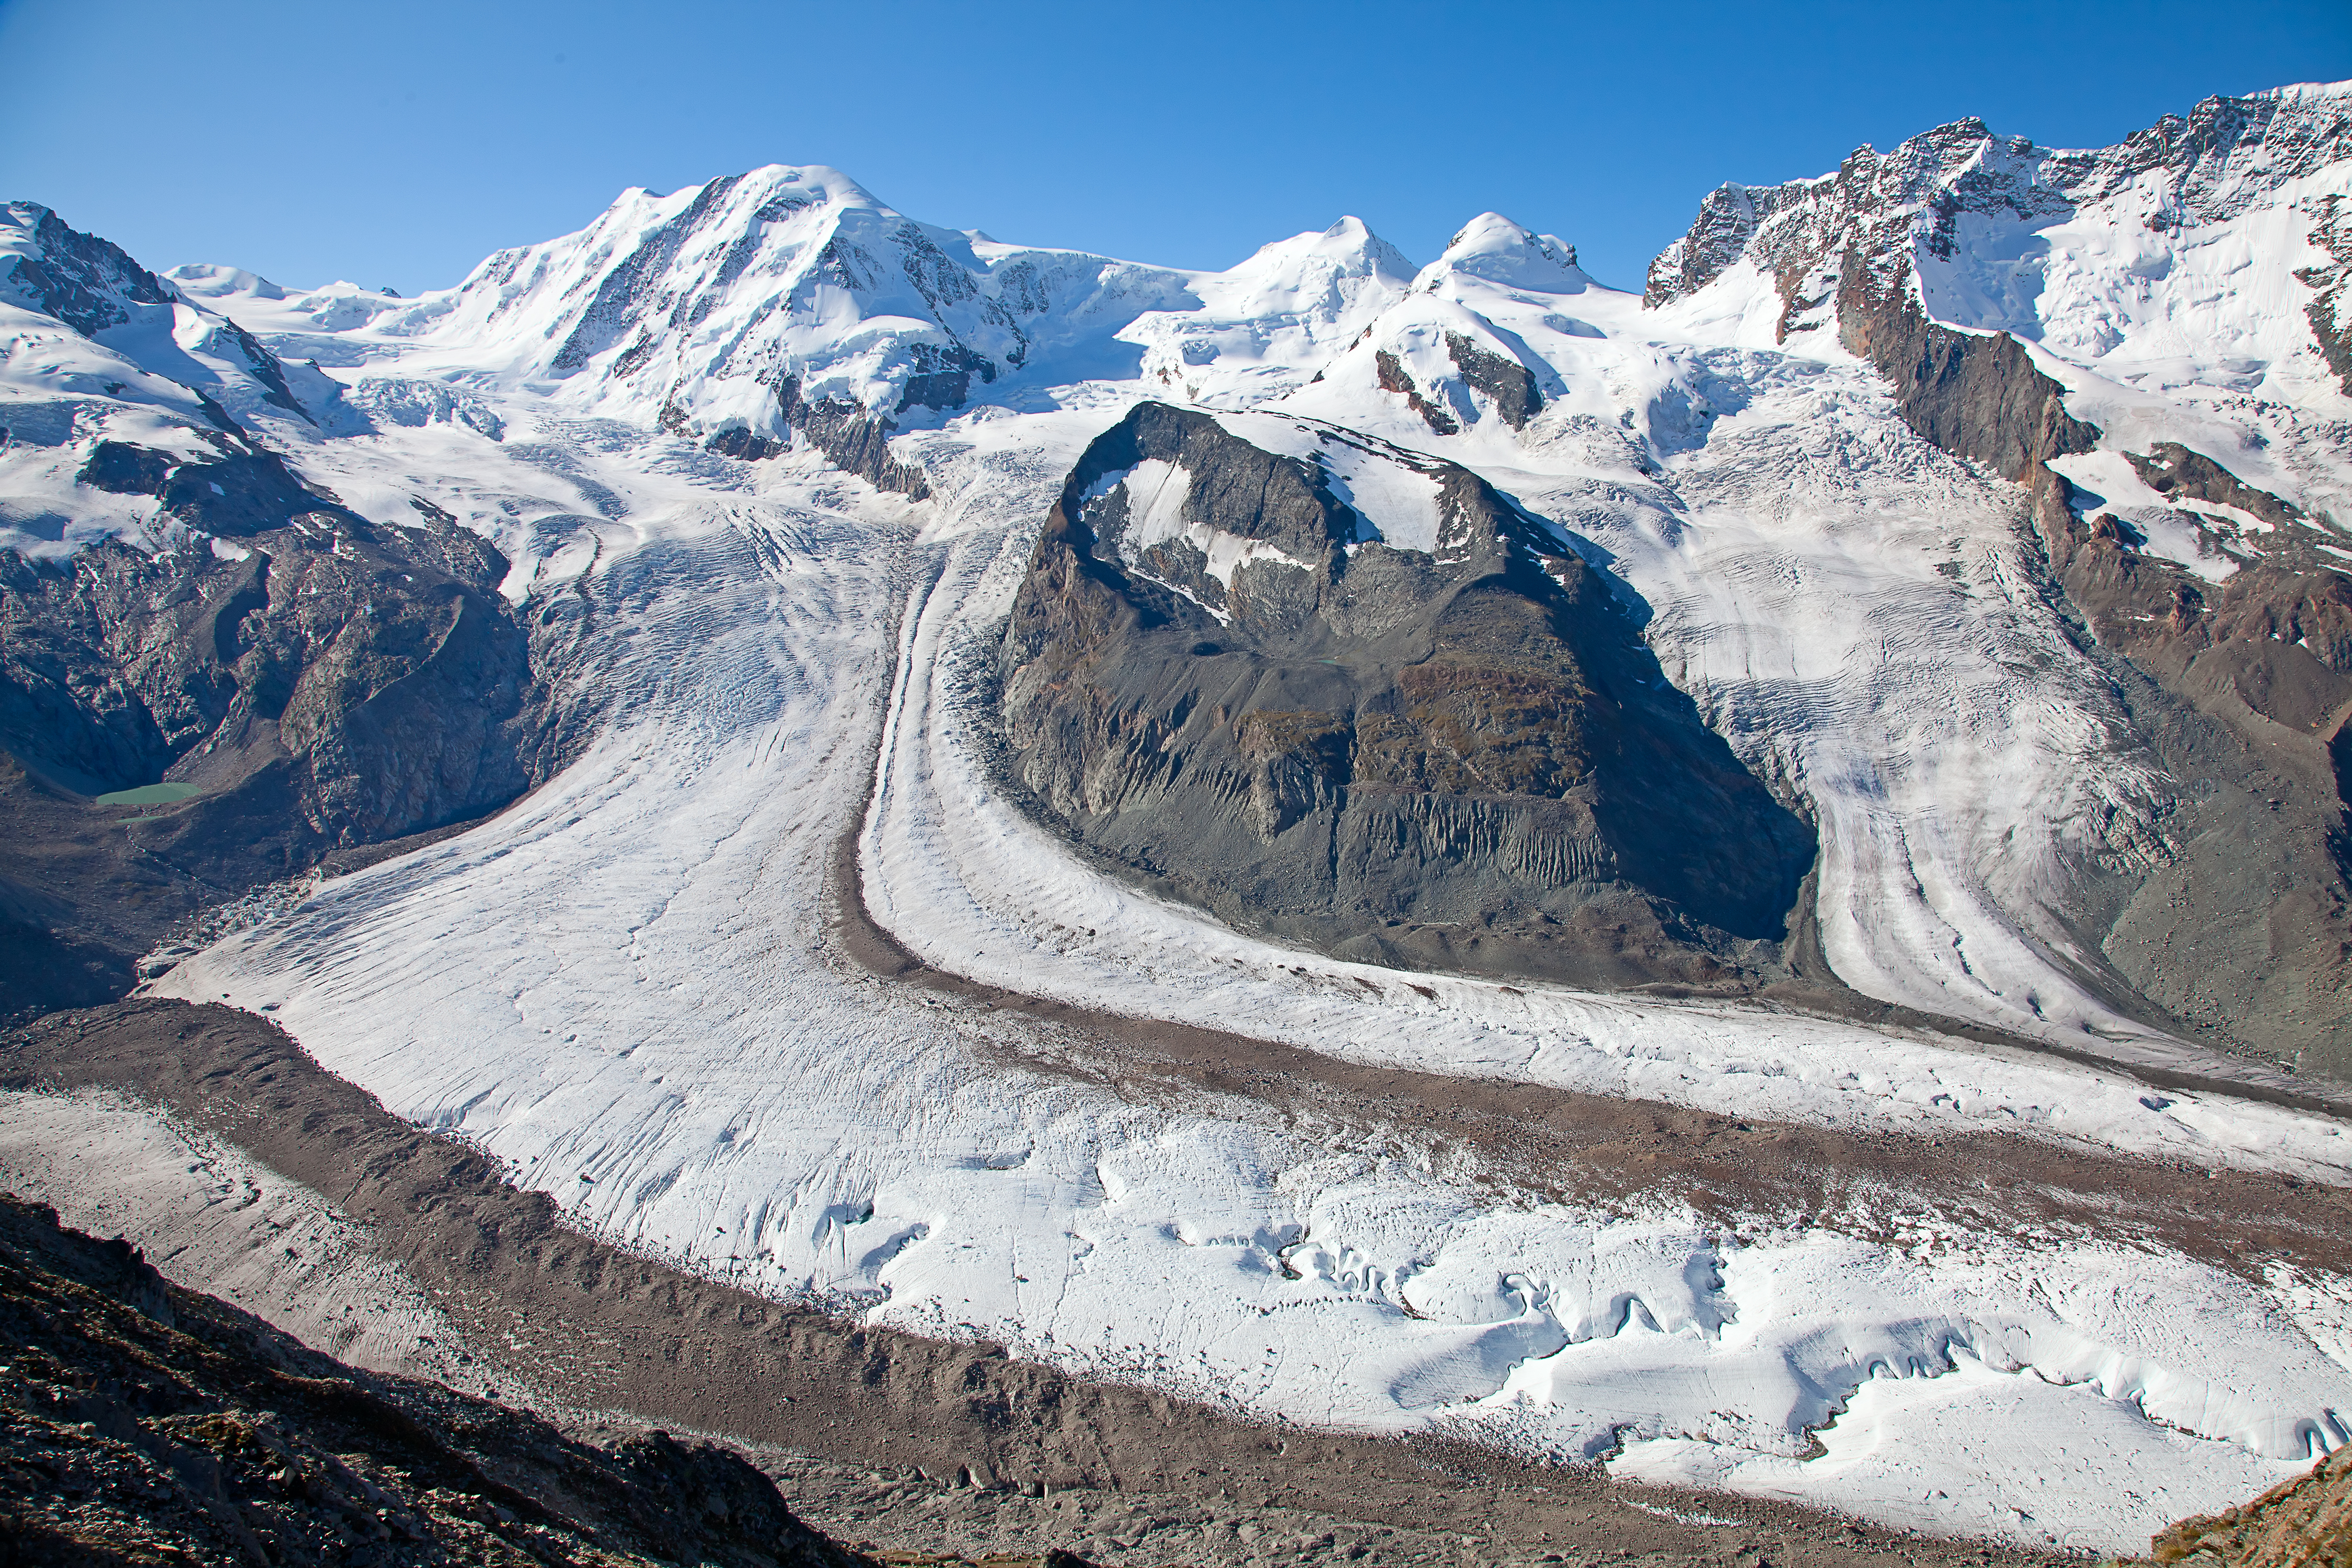
- Measuring the depths from glaciers and snow layers
- Di-section of water bodies, measuring depth and upcoming layers
- Geology, locating and analysing soil, rock and water layers
- Investigating and mapping animal burrow systems
- Locating pipes and drilling positions
- Locating mines from wars
- Archaeology
- finding water wells
- interpreting the depths and type of rock and soil layers
Case Study 1
Use study Huber & Huggenberger (2016)
-
Where and with which specifications?
100 MHz antenna in overlapping cross pattern, Figure 2 -
What was the goal?
estimate sediment structures and layers comparing to hydrogelocial models -
What data did they use?
processed line images, Figure 4
Case Study 2
Use study McCarthy et al. (2017)
-
Where and with which specifications?
Figure 1., page 545 Lirung Glacier in Nepal with multiple antenna frequencies 225, 450, 900 and 1200 MHz. overlapping cross pattern -
What was the goal?
Measuring the debris and glacial mass -
What did they use?
Table 1 and Figure 4
Case Study 3
Use study Cortez et al. (2013)
-
Where and with which specifications?
Naval Air Station Corpus Christi,Texas USA 900 MHz antenna, raster pattern -
What was the goal?
locate and measure burrow and tunnel structures of burrowing rodents -
What data did they use?
2D to 3D data transformation, tunnel dimension
Task
-
As preparation for you, we want you to think about a possible research question.
-
You can use the already provided and discussed data sets as well as to search for your own data online.
-
Utilize the data in Ilias or try this collection
Further data sets: