10 Visualization
Transform to 3D, visualization and interpretation of results
Handling 3D data sets
-
What kind of object do we have here?
-
How can work with it?
-
How can we manipulate it and extract secondary information?
# general path set up
myDir <- file.path("C:/Users/yourname/Documents/radarkurs/Grid-dir2-Rawdata")
setwd(myDir)
# load library
library(RGPR)
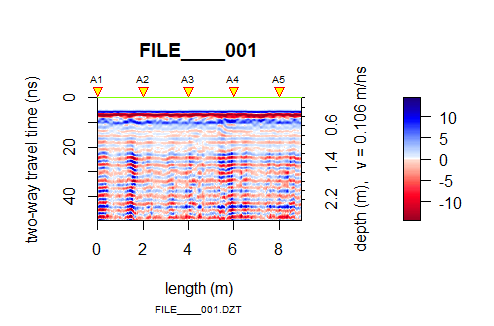
#read one single line in one object
grid_file<-readGPR(dsn="FILE____001.DZT", verbose = F)
#load all lines from data set
grid_lines<- file.path(paste0("FILE____", sprintf("%03d", 1:46), ".DZT"))
#create GPR survey object with all lines
grid <- GPRsurvey(grid_lines, verbose = FALSE)
#set default grid coordinates
setGridCoord(grid) <- list(xlines = seq_along(grid),
xpos = seq(0,
by = 0.2,
length.out = length(grid)),
ylines = NULL,
ypos = NULL)
# apply filters
grid <- papply(grid,
prc = list(estimateTime0 = list(method = "coppens", w = 2),
# "NULL" because we take the default
time0Cor = NULL,
dewow = list(w = 3),
gain = list(type = "agc", w = 1.2) #,
# traceStat = list(w = 20, FUN = mean),
# envelope = NULL)
))
#create cube object
SXY <- interpSlices(grid, dx = 0.05, dy = 0.05, dz = 0.05, h = 6)
3D Visualization
#new library RGL R-openGL
#please install first!
library(rgl)

#setting the properties of a cube
c3d <- cube3d(color="green", alpha=0.1)

#what kind of object is it?
c3d

#plot the cube
#an interactive window opens- try and use your cursor on the cube!
shade3d(c3d)

#save a quick image
# works with many plot functions when an interactive window was opened
rgl.snapshot("cubes3d.png")

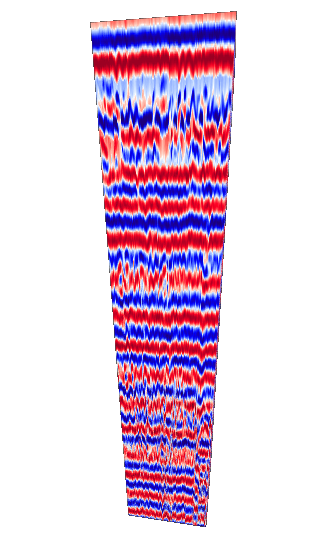
#plot the single lines together in an interactive 3D window
#note: this function is from the package RGPR again!
plot3DRGL(grid)

# plot only selected lines
plot3DRGL(grid[1:3])
#plot single line
*** Class GPR ***
plot(grid_line)
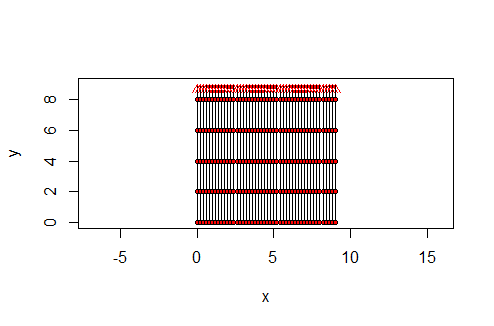
#plot type GPR survey -> plotting the current position of GPR lines in the summarizing object
*** Class GPRsurvey ***
plot(grid)
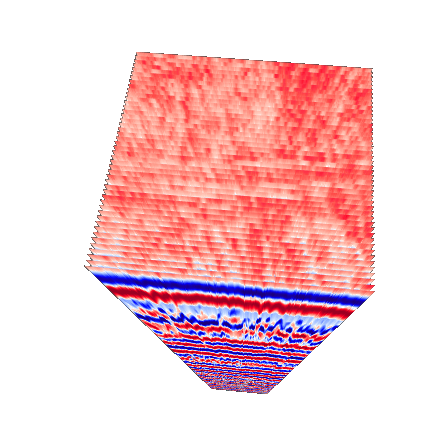
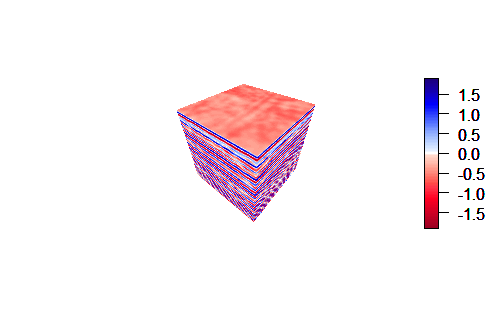
#plot type GPR cube

be careful: very long processing time !!!

*** Class GPRcube ***
plot(SXY)
3D object structure
#single line object
grid_file

#the str() function reveals all stored information within the data object we are handling in R
# all objects in R can be accessed with this function
str(grid_file)

#the standard symbols in R to access information within any object are "@" and "$"
#tipp: use the "tab" button on your keyboard to display the options
grid_file

grid_file@version
grid_file@data
grid_file@traces

#GPR survey object
grid

grid@names
grid@ntraces
grid@coords
grid@coords$FILE____001 #oder
grid[[1]]
grid[1]

#GPR cube
SXY

SXY@x
SXY@y
SXY@depth
SXY@data