Radiogram and Interpretation
Radiogram
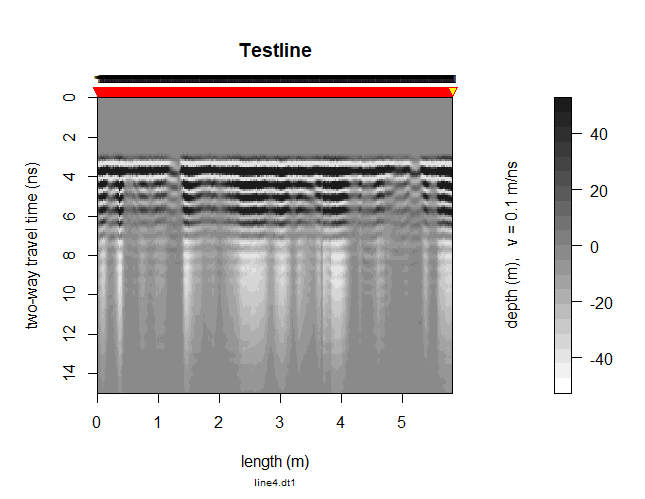
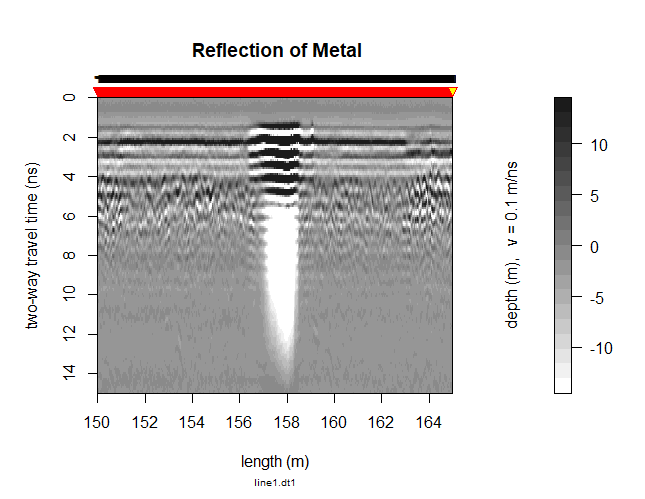
A radiogram builds a cross sectional image from the echoes. Objects appear in the taken radiogram of the ground as hyperbolic reflections in the shape of a hyperbola. The bigger the hyperbolic reflection the bigger the object in the ground. Different types of earth layers appear as a thicker line or multiple lines with little space in between.
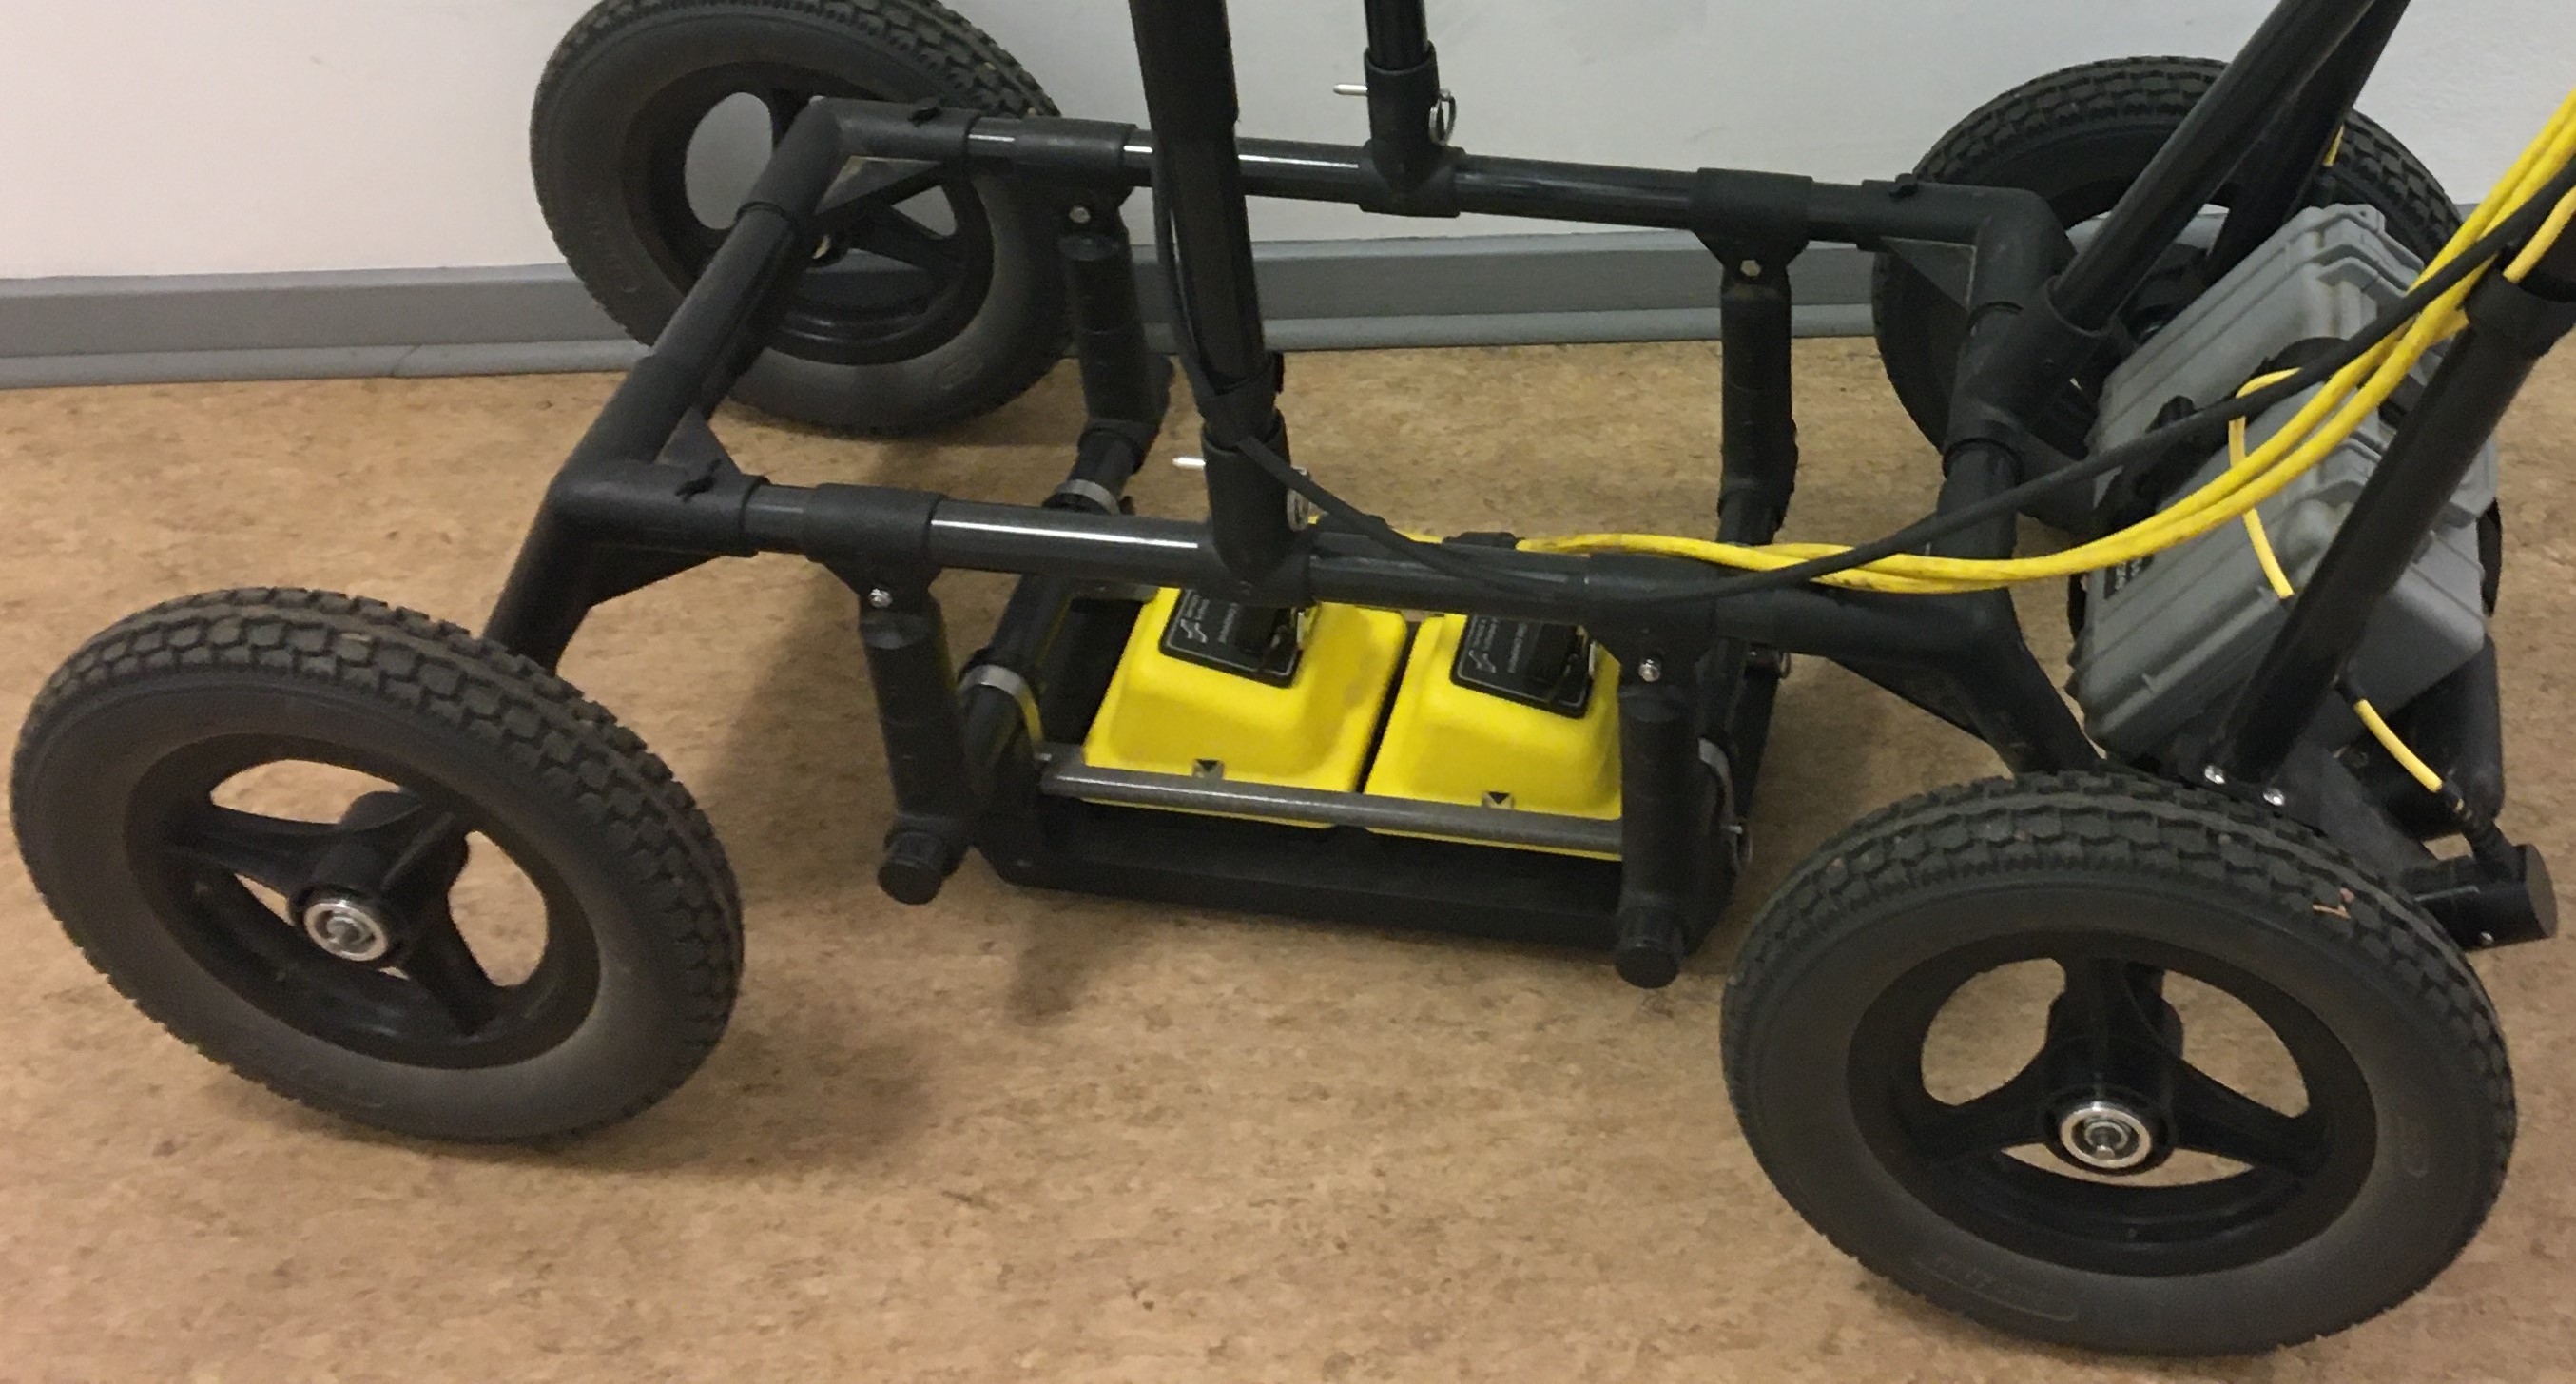
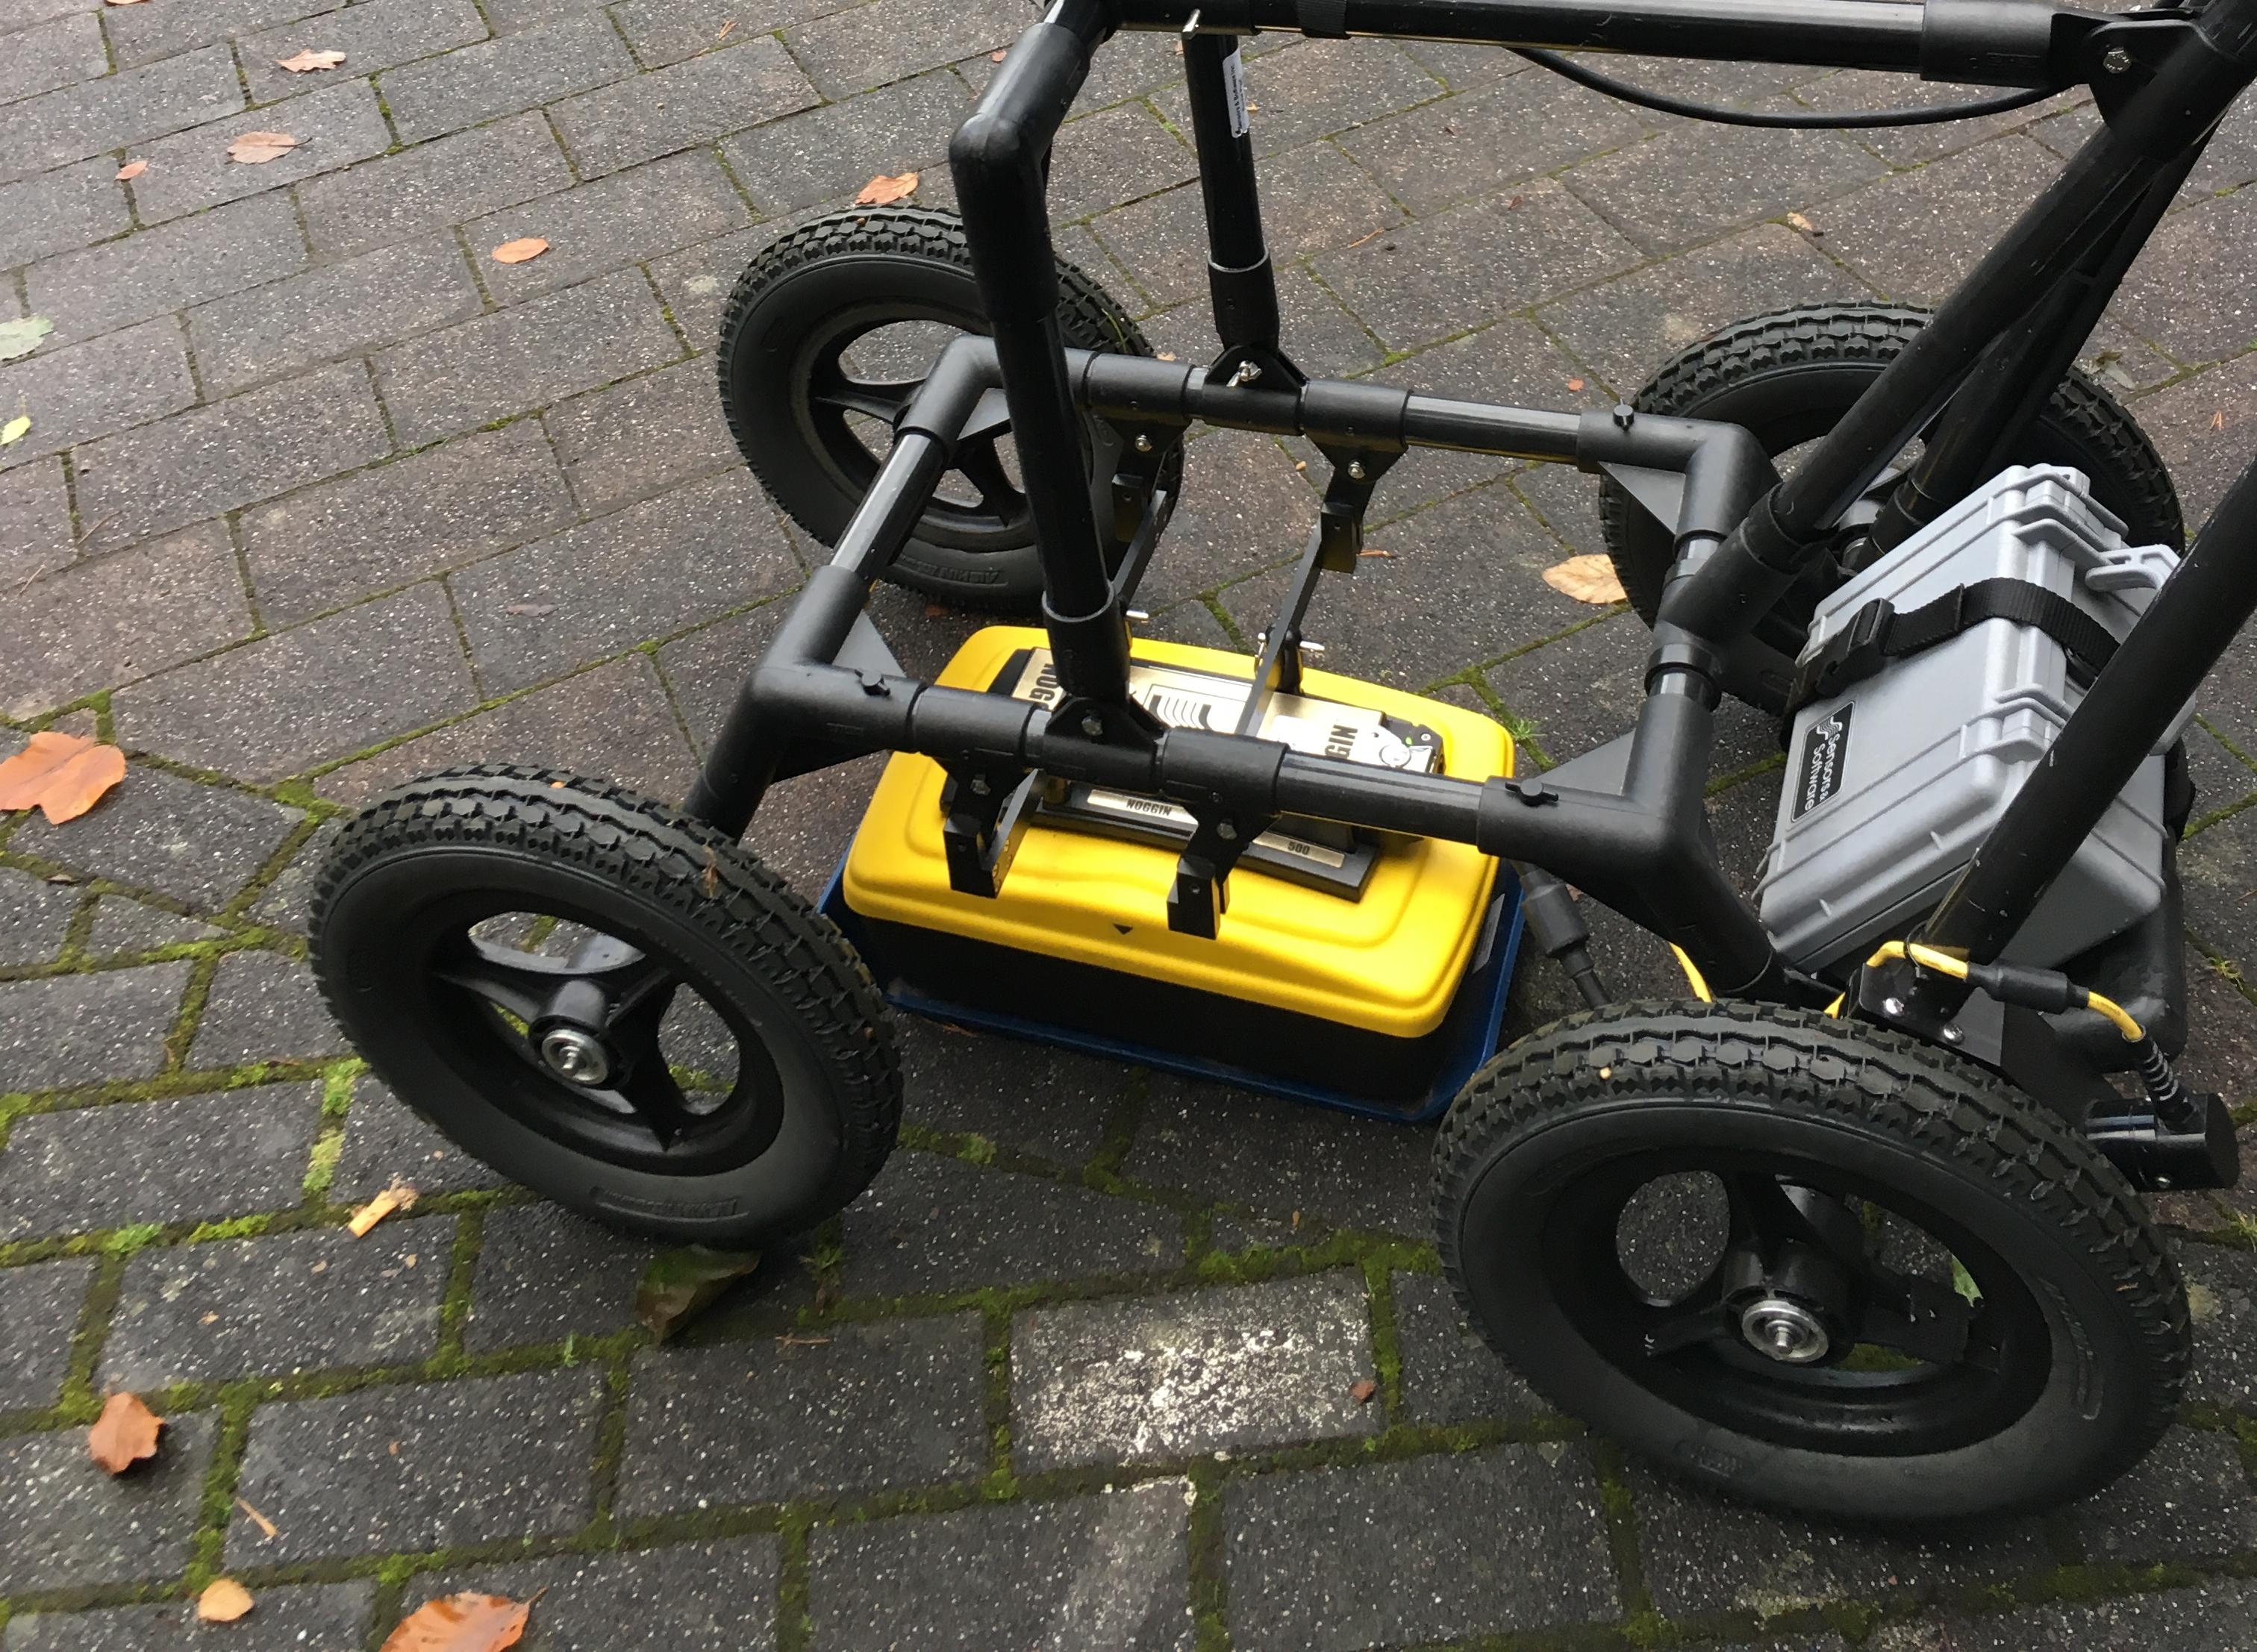
Radar can be easily disturbed if not correctly attached to the measuring surface (airwaves and falsification of the target) or by devices using the same frequency as the radar. In most common ground radar devices, the antennas are shielded inside a box.
Common Frequency options
12.5, 25, 50, 100, 200, 250, 500, 800, 900 and 1000 MHz
The size of the antenna shrinks with increasing MHz number.
Which frequency?
The basic rule:
The higher the frequency, the more detailed the radiogram and its reflected objects can be. But the shorter the travelling depth of the signal.
The materials you are investigating are also influencing the depth and detail of your result!
Example 1: Investigating the rock, soil or permafrost layers in 50m depth you will need an antenna with a low frequency like 250 or 100MHz.
Example 2: Searching for world war two bombs in 5- 10 m ground you can 500 MHz antenna.
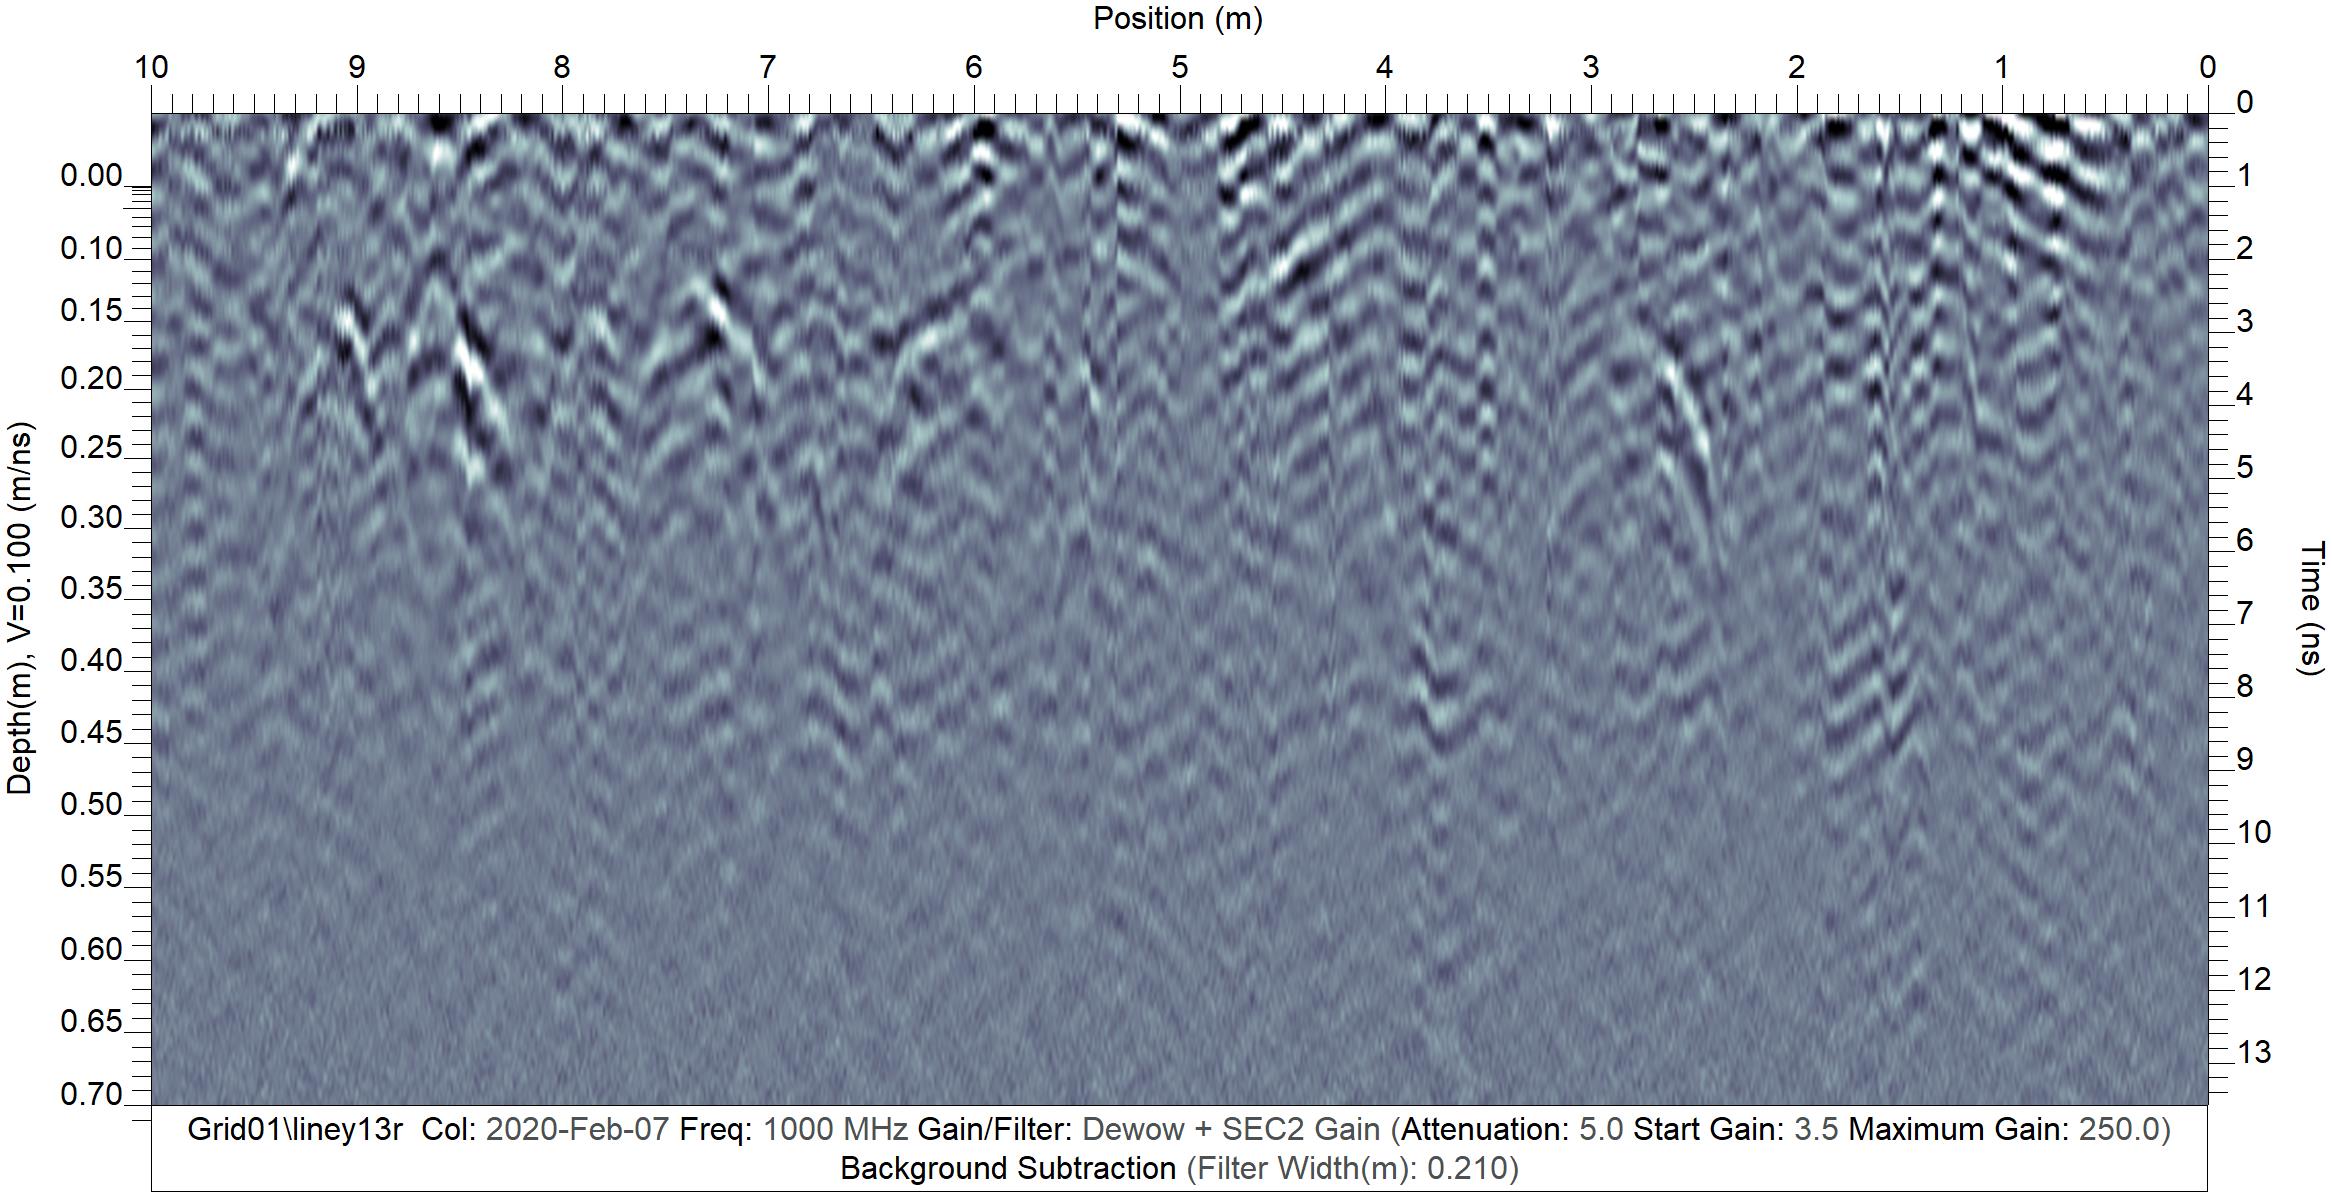
Example 3: If you are looking for Giant Molerats burrows in the first soil layer until 70cm depth, you should use 1000MHz
More methods
The methods described above is called the reflection method. But there are more methods than reflection, like: CMP - Common mid point, WARR - wide area reflection and translumination surveys.
Translumination can be further distinguished to ZOP - zero offset profile, MOG - multi offset gather and VRP - vertical radar profile. With different applications the methods are also adapting to get the best possible results of the survey.
During this course we will only focus on the reflection method.