Radar in R
First steps
Set your environment and paths in R
myDir <- file.path("C:/Users/yourname/documents/radar_seminar/")
setwd(myDir)
Test if the directory is set correct
getwd()
Remember: Save script in your folder structure
Install the devtools and RGPR packages… this may take a while
#devtools
install.packages("devtools")

#install RGPR
devtools::install_github("emanuelhuber/RGPR")

#load library
library(RGPR)
Load data file into R
x<-readGPR(dsn = "line1.dt1", verbose = FALSE)
Let’s have a look on our data file!
x
dim(x)
str(x)
slotNames(x)
A <- x[90:200, 5:10]
Plotting radar data in R
plot(x)
These are the default setting for the radargram. But sometimes we cannot see everything on a first view. Some details may be more visible if we change the colour settings.
displayPalGPR()
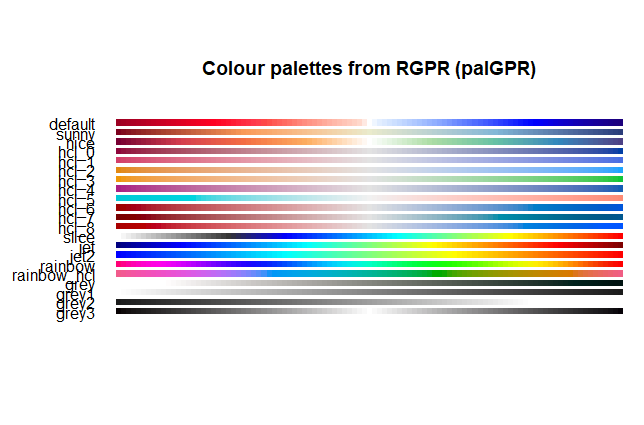
Select a colour palette and test if it looks good to represent your data in a meaningful way.
You can also try some experimental colours first. ![]() The range describes into how many sections you want your palette separated.
The range describes into how many sections you want your palette separated.
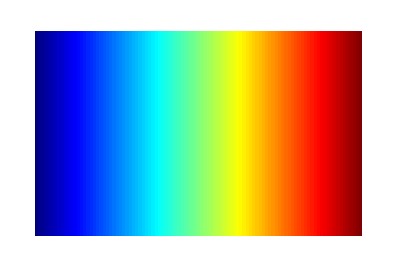
#plot the rainbow colours palette
plotPal(palGPR("rainbow"))
#select colour palette and range
plot(x, col = palGPR("rainbow"))

plot(x, col = palGPR("nice", n=5))

plot(x, col = palGPR("nice", n=30))
More details
Its possible that during your analysis you want to display a specific section of your results. You can zoom into the plot by selecting a custom range on the X- and Y-axis.
plot(x, col = palGPR("nice", n=5),ylim = c(0, 350), xlim = c(0,50))
A titel, correct labeled axes help to understand the plot better. Those extra commands can be used in any plots you create inside R - not just within this specific package.
plot(x, col = palGPR("nice", n = 30)
     ,ylim = c(0,300)
     ,xlim = c(0, 50)
     ,main= "Testline"
     ,xlab= "meters along surface"
     ,ylab= "two-way travel time in ns")
Saving and Exporting
Exporting of the plot images can be done in two ways. You can either do it by hand or do it all within the script.
#open command / make empty file
png(file=paste0("C:/Users/yourname/documents/radar_seminar/output/testline_plot.png",
    width=600, height=350)

#plot with your settings
plot(x)

#closing the command in r and saving the plot as image to your directory
dev.off()